Japan accounts for just 2.2% of global gamers but generates 9.1% of worldwide gaming revenue, ranking third after China and the U.S. The disparity underscores the country’s exceptional monetisation per user. The market climbed 4.3% to ¥2.48 trillion in 2024. Yet measured in U.S. dollars, Japan’s gaming market contracted 3.3% to $16.6 billion – a victim of yen weakness that last year hit its lowest level against the dollar since 1986.
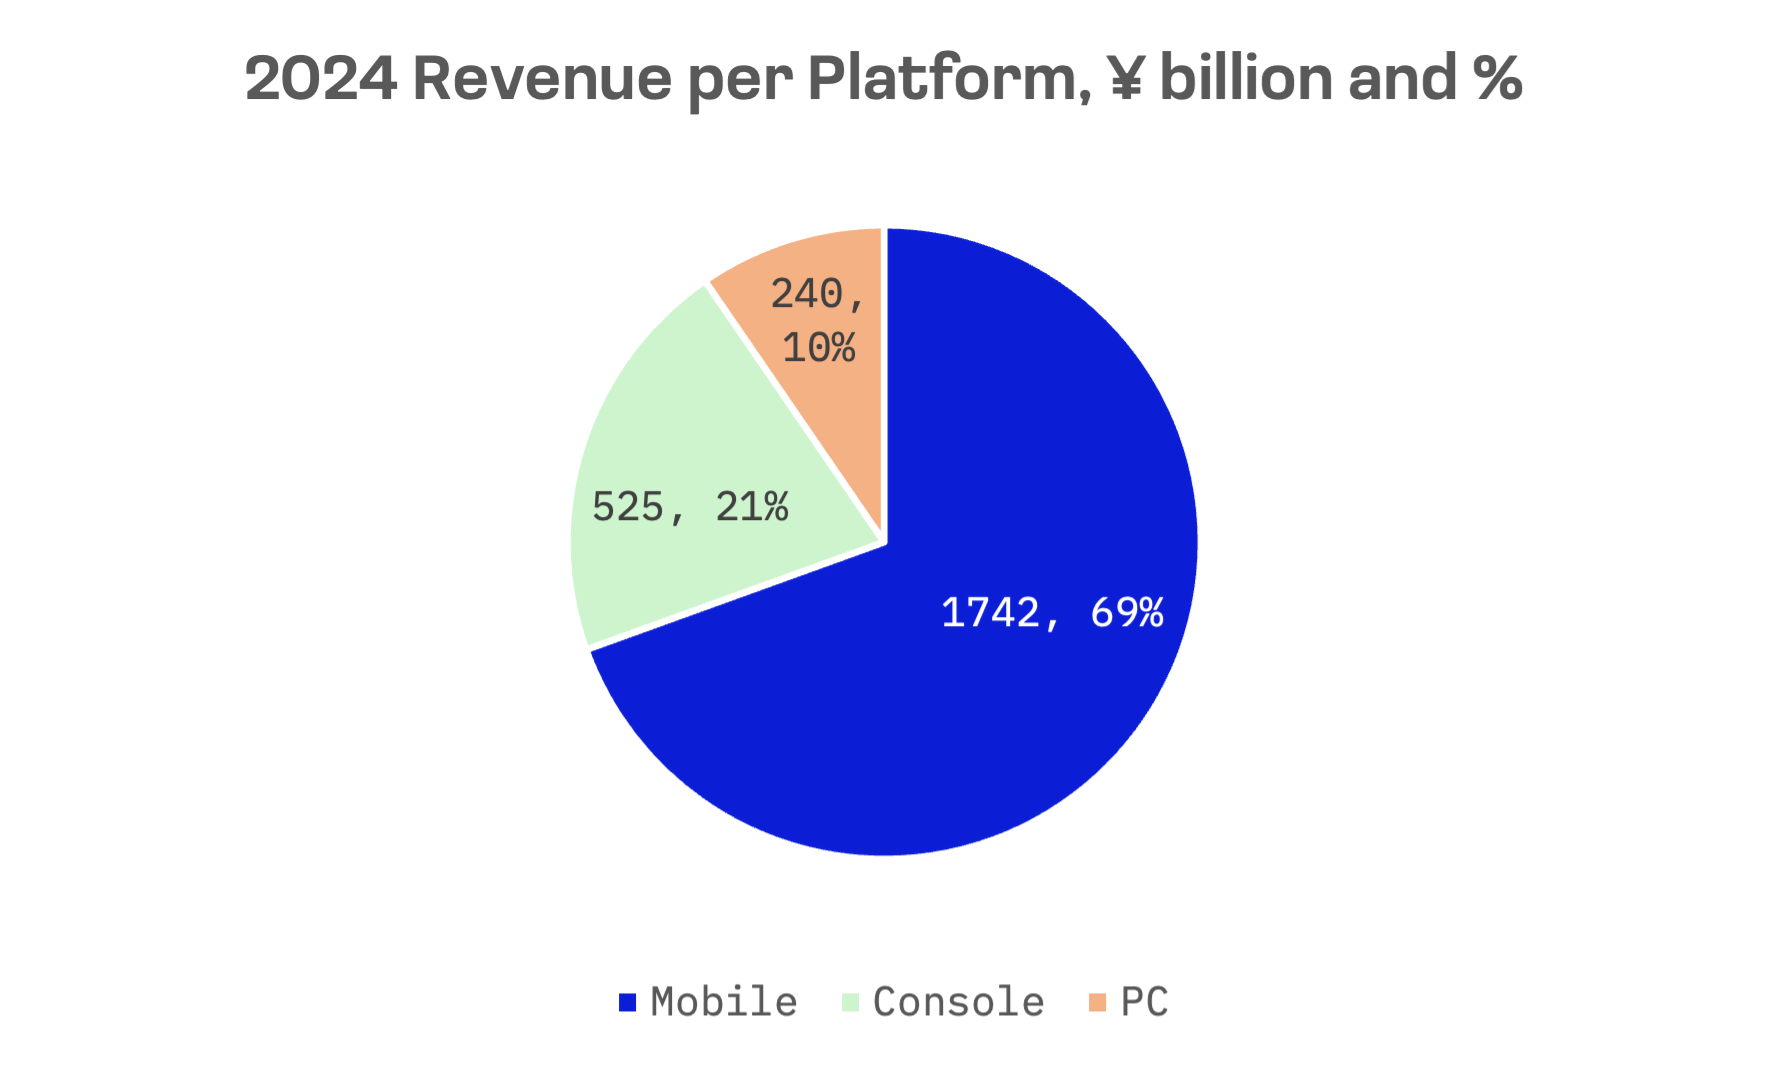
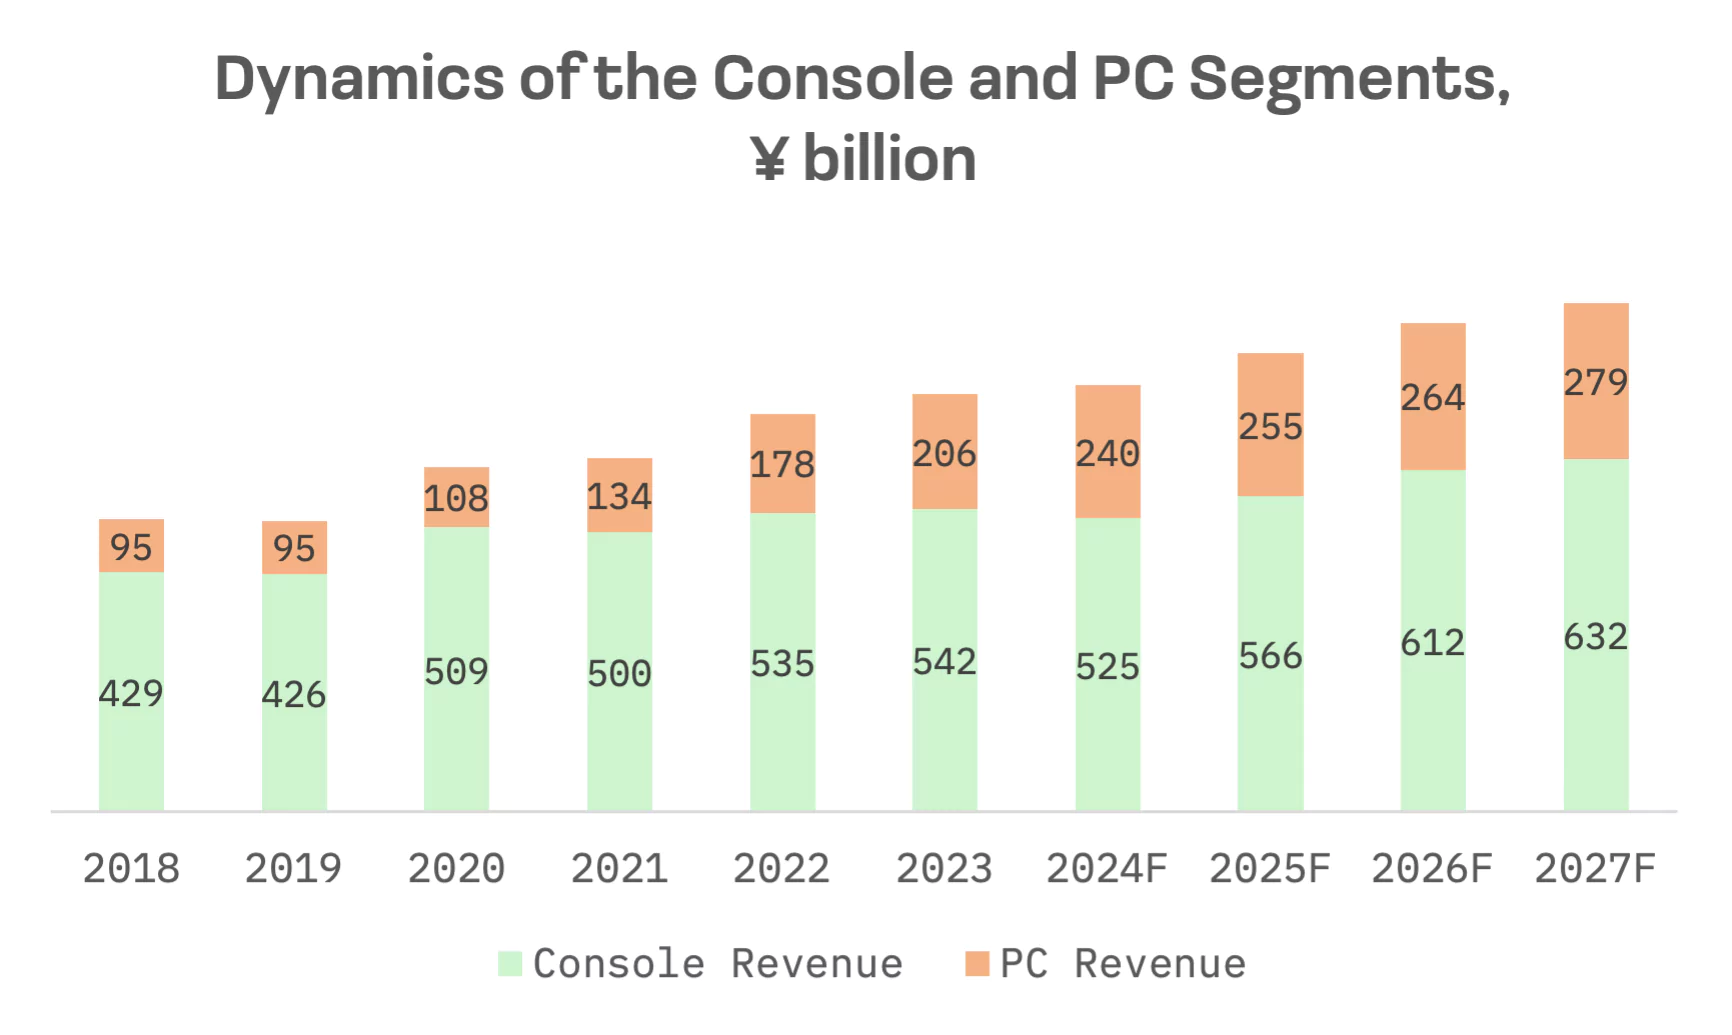
The PC segment delivered the strongest gains, surging 16.2% to ¥240 billion and 7.8% in dollar terms to $1.6 billion. Though it represents the smallest slice of Japan’s gaming market, PC captures 4.1% of global revenue with just 2.9% of players, a sign of strong per user engagement.
Consoles fared worse. The segment contracted 3.1% to ¥525 billion and 10.1% in dollar terms to $3.5 billion, dragged down by sluggish premium game sales and aging Nintendo Switch hardware awaiting a successor. Japan remains the world’s second largest console market, accounting for 8% of global revenue and 6.2% of players.
Nintendo’s Switch continues its dominance of Japan’s console market. By the end of 2024, it had sold 35 million units – roughly 70% of the installed base. PlayStation trailed with 14.4 million units, or 29%. Xbox barely registered at 760,000 units, claiming a 1% share. Despite shrinking revenue, consoles remain integral to Japan’s gaming culture, buoyed by Nintendo’s entrenched local appeal.
Analysts project both PC and console segments will keep expanding. PC revenue is forecast to grow at a 5.1% CAGR from 2024 to 2027, with consoles growing at 6.3%.
Mobile, the market’s largest segment, rose 5.2% to ¥1.742 trillion but fell 2.4% in dollar terms to $11.5 billion. Japan ranks third globally in mobile gaming, generating 11.5% of total revenue while representing only 2% of players, the widest such gap in any gaming segment. The numbers underscore the exceptional spending power of Japanese mobile gamers, who on average spend roughly three times what their U.K. counterparts do.
Japan is also pushing into cloud gaming. The backend infrastructure market remains nascent but is forecast to expand at a 27.7% CAGR from 2025 to 2032.
A handful of companies dominate Japan’s gaming landscape, despite a diverse roster of smaller players:
| Company Name | Segment | Products | Market Position |
| Nintendo | Consoles | Game consoles (Nintendo Switch, Nintendo Switch Lite), popular game franchises (Mario, The Legend of Zelda, Pokémon, Animal Crossing, Donkey Kong) | A leader in the console market, particularly with the success of the Nintendo Switch |
| Sony | Consoles | Game consoles (PlayStation 5, PlayStation 4, PlayStation VR2), accessories | A leader in the console gaming market with its globally recognised PlayStation brand |
| Bandai Namco | Video games | Video games for various platforms: Pac-Man, Tekken, Dragon Ball, Gundam; toys; vending and amusement machines | Diversified entertainment company with a strong focus on “single content, multiple usage” |
| Konami | Video games | Video games, mobile games, card games, amusement machines | Strong presence in historical game franchises |
| Capcom | Video games | Video games for consoles, PCs, mobile and arcade machines: Resident Evil, Monster Hunter, Street Fighter, Mega Man and Devil May Cry | Strong presence in the fighting game and survival horror genres, with a focus on its “single content, multiple usage” strategy |
| Square Enix | Video games | Video games for consoles, PCs, and mobile devices: Final Fantasy, Dragon Quest and Kingdom Hearts | Strong presence in the RPG genre |
| Sega Sammy | Video games | Video games for consoles, PCs and mobile: Sonic the Hedgehog, Yakuza/Like a Dragon, Persona; amusement machines | Strong presence in both the video game and amusement machine markets |
| Koei Tecmo | Video games | Video games for consoles, PCs and mobile: Dynasty Warriors, Nioh, Ninja Gaiden, Dead or Alive and the Atelier series | Strong presence in strategy and RPG genres |
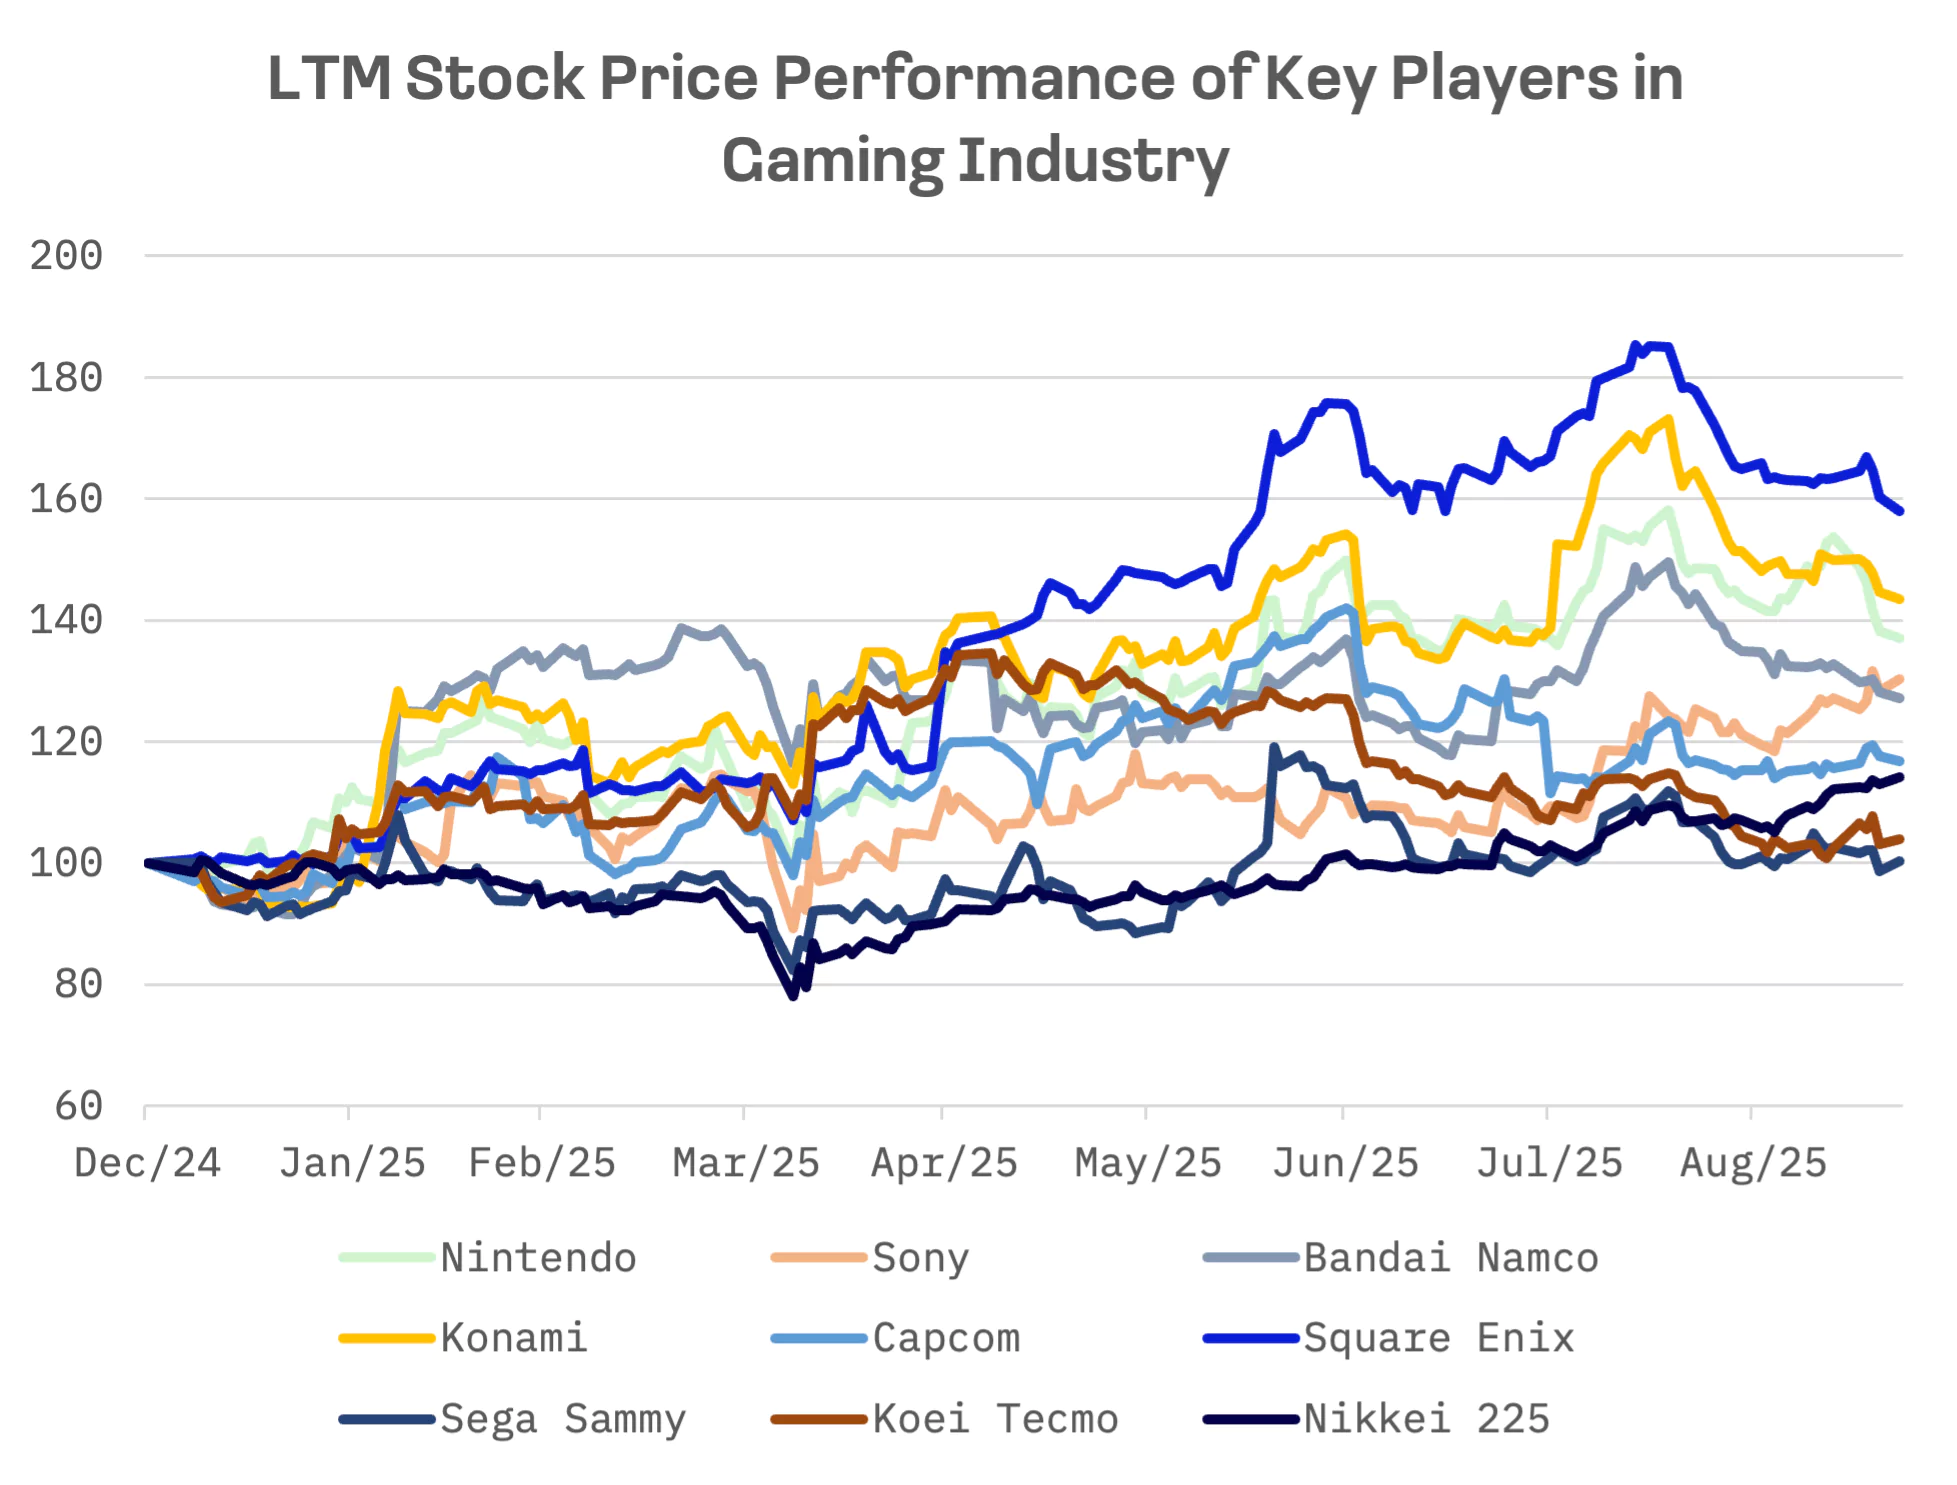
All eight companies trade publicly on the Tokyo Stock Exchange. Five belong to the JAKOTA Blue Chip 150 index; three are constituents of the JAKOTA Mid and Small Cap 2000:
| Company Name | Ticker | JAKOTA Index | Market Cap, USD |
| Nintendo | 7974.TSE | Blue Chip 150 | 100.9B |
| Sony | 6758.TSE | Blue Chip 150 | 175.0B |
| Bandai Namco | 7832.TSE | Blue Chip 150 | 21.2B |
| Konami | 9766.TSE | Blue Chip 150 | 19.6B |
| Capcom | 9697.TSE | Blue Chip 150 | 11.6B |
| Square Enix | 9684.TSE | Mid and Small Cap 2000 | 8.0B |
| Sega Sammy | 6460.TSE | Mid and Small Cap 2000 | 4.3B |
| Koei Tecmo | 3635.TSE | Mid and Small Cap 2000 | 4.1B |
Every company in the peer group has posted gains year to date through September 22, with most outpacing the Nikkei 225. Square Enix leads the pack as the top performing Nikkei 225 stock in 2025, soaring nearly 60%.
Nintendo has the highest valuations across every metric, a reflection of elevated growth expectations and its commanding 78% share of Japan’s console gaming market:
| Company Name | EV/Sales | EV/EBITDA | P/E |
| Nintendo | 11.15x | 43.61x | 53.48x |
| Sony | 1.99x | 9.33x | 21.98x |
| Bandai Namco | 2.34x | 12.77x | 24.45x |
| Konami | 6.25x | 19.81x | 38.46x |
| Capcom | 9.20x | 22.17x | 35.21x |
| Square Enix | 2.93x | 19.72x | 48.31x |
| Sega Sammy | 1.50x | 8.84x | 14.53x |
| Koei Tecmo | 7.19x | 17.57x | 16.84x |
| AVERAGE | 5.32x | 19.23x | 31.66x |
| MEDIAN | 4.59x | 18.65x | 29.83x |
Nintendo
Nintendo has long pursued what it calls a “blue ocean” strategy, setting itself apart from Sony and Microsoft by sidestepping the graphics arms race. Instead, the company built a vertically integrated hardware-software ecosystem. It designs, manufactures and sells its own consoles, creating a closed platform for its lucrative first party titles.
The strategy is paying off. When Nintendo launched the Switch 2 on June 5, 2025, it sold more than 3.5 million units in four days, the fastest launch in company history for a dedicated gaming platform.
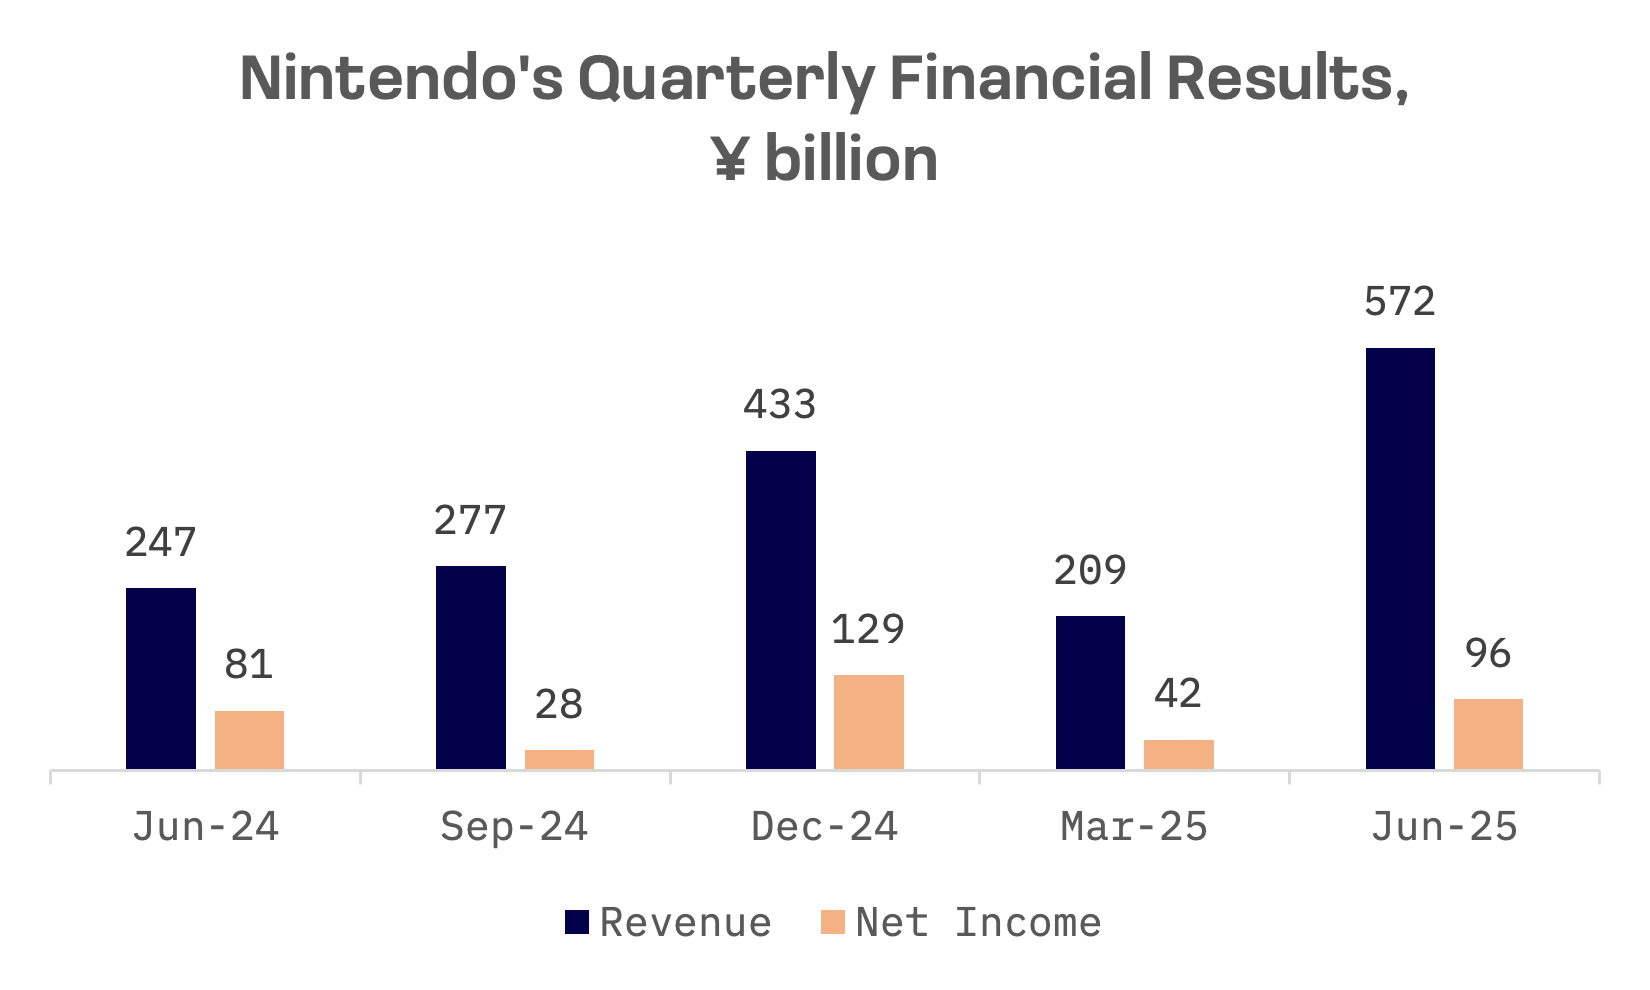
Nintendo reported first quarter fiscal 2025 net sales of ¥572.3 billion, up 132.1% from a year earlier. The Switch 2 rollout drove the surge; the company forecasts 15 million units sold in the console’s first year – a target some analysts call conservative.
Nintendo: Key Financial Indicators, ¥ billion
| Fiscal Q1 2026 ending 06/30/25 | Y/Y change, % | |
| Revenue | 572.36 | 132.07% |
| EBITDA | 60.77 | 3.04% |
| Net income | 96.03 | 18.63% |
Revenue jumped, but margins took a hit. Gross profit margin tumbled 29.5 percentage points to 32.3%. The drop reflects a deliberate tradeoff: hardware, which carries lower margins, now accounts for a larger share of sales than higher margin software and subscription services.
Square Enix
Square Enix’s rally tells a different story. The stock’s gains owe more to investor enthusiasm than operational strength. Trading volumes have spiked and analysts have upgraded the stock, even as the company missed revenue and earnings-per-share (EPS) targets in its most recent quarter.
What’s driving the optimism? Square Enix has pledged a strategic “reboot” emphasising “quality over quantity” and a shift to multiplatform game releases. That message – amplified by speculation about activist investor involvement – has overshadowed disappointing first quarter results.
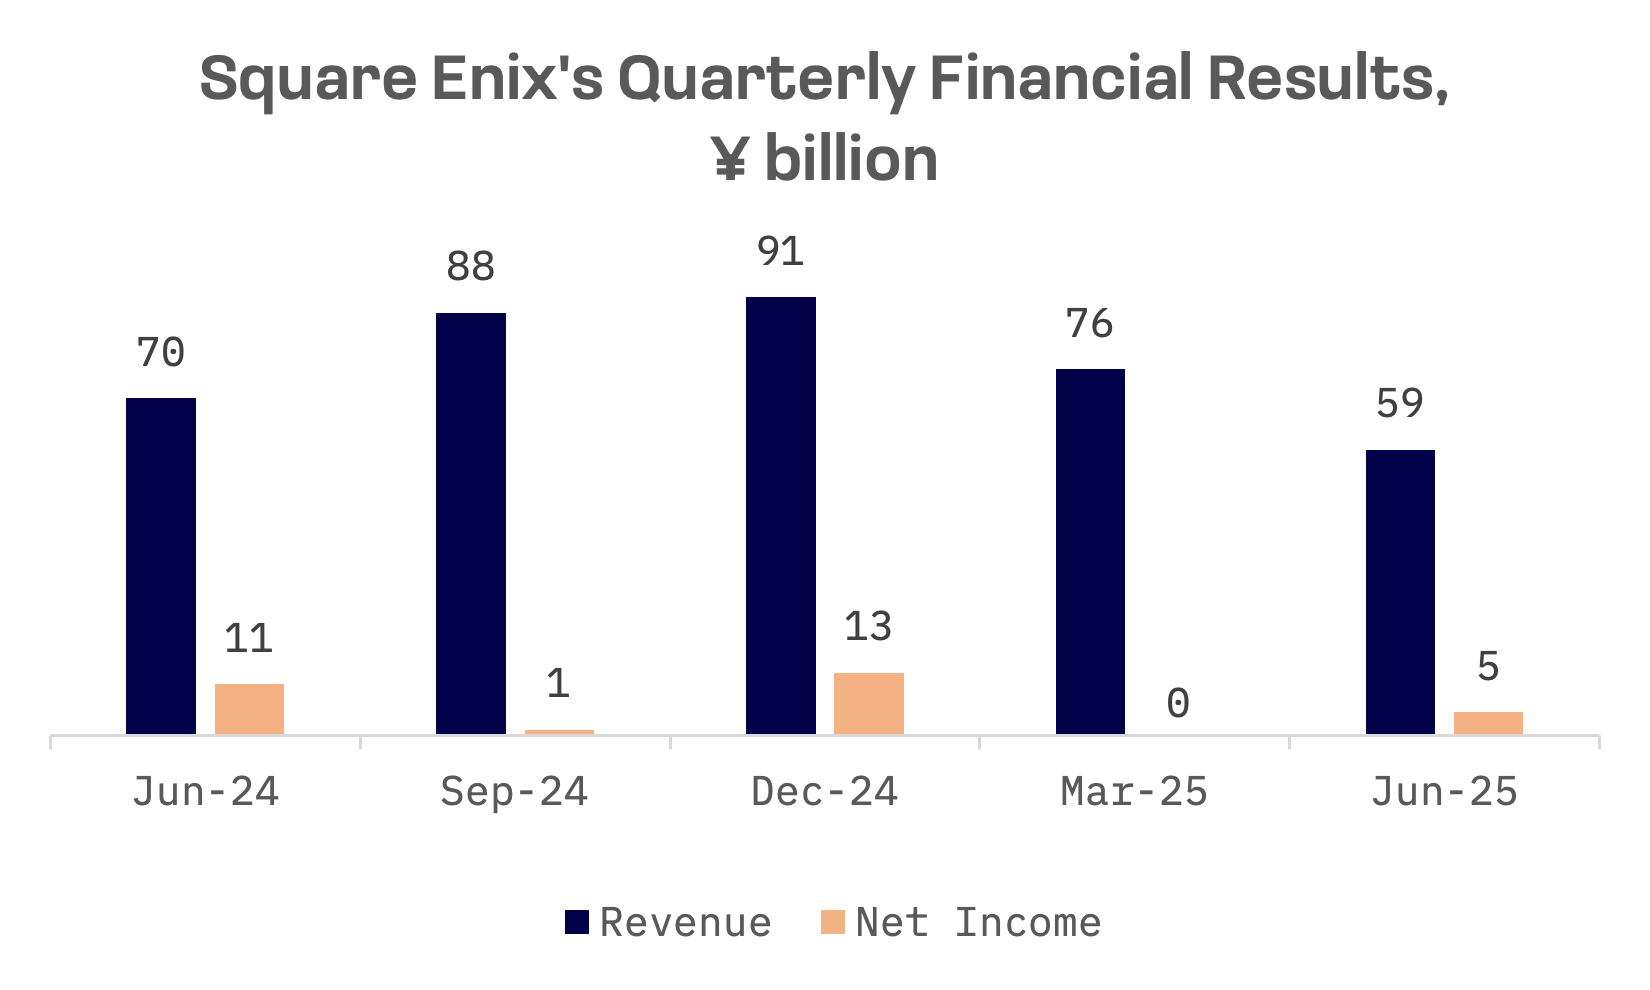
The weak Q1 financial results stem directly from the reboot itself. Square Enix discontinued several titles and halted development on key projects as part of the strategic overhaul.
Square Enix: Key Financial Indicators, ¥ billion
| Fiscal Q1 2026 ending 06/30/25 | Y/Y change, % | |
| Revenue | 59.28 | -15.22% |
| EBITDA | 11.13 | -12.57% |
| Net income | 4.80 | -54.76% |
Japan’s gaming industry is poised for steady growth, with mobile remaining the fastest expanding segment. Cloud gaming and AR/VR technologies are expected to propel further gains. The market’s trajectory hinges on capitalising on its high ARPU mobile base while successfully monetising emerging platforms and technologies.