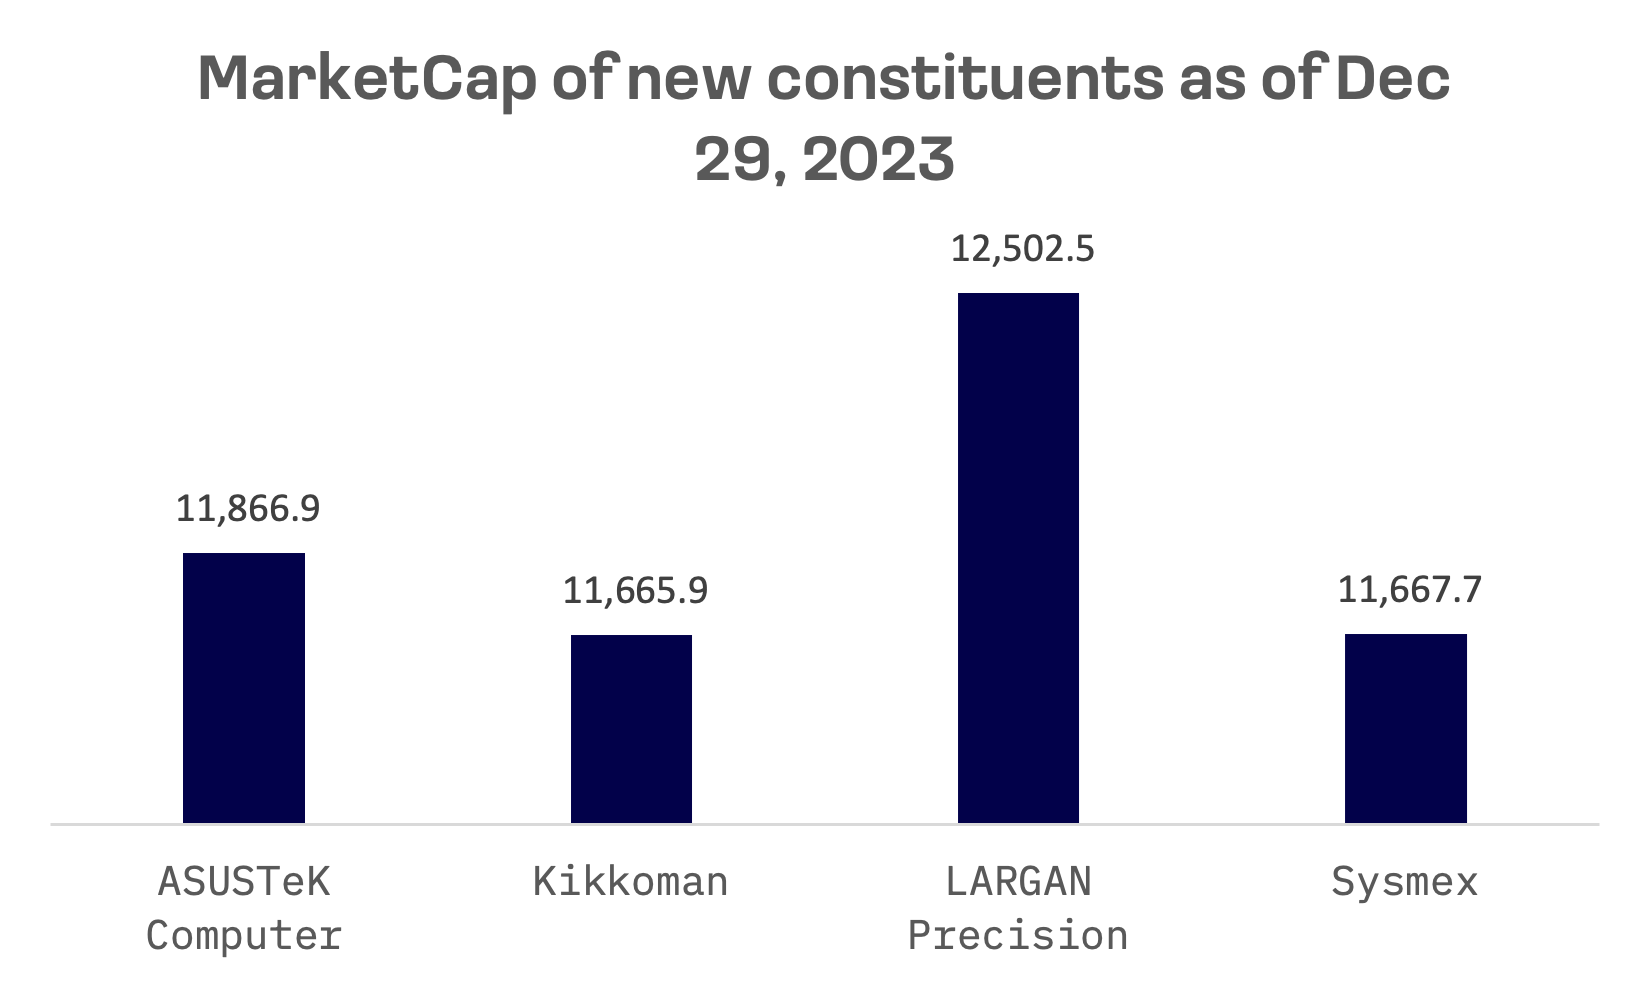
As part of its routine quarterly rebalancing, the JAKOTA Blue Chip 150 Index has incorporated four new companies, effective from the beginning of 2024:
ASUSTeK Computer (2357.TW): A Taiwanese multinational manufacturer in the computer, phone hardware, and electronics sector, ASUSTeK is recognized as the world’s 5th-largest PC vendor by unit sales.
Kikkoman (2801.TSE): A Japanese food manufacturer, Kikkoman stands out in producing a variety of culinary essentials, including soy sauce, seasonings, flavorings, mirin, shōchū, and sake.
LARGAN Precision (3008.TW): Based in Taiwan, LARGAN Precision is the world’s leading supplier of smartphone camera lenses.
Sysmex (6869.TSE): A Japanese manufacturer that specializes in the production of diagnostic instruments and reagents, with a primary focus on hematology applications.

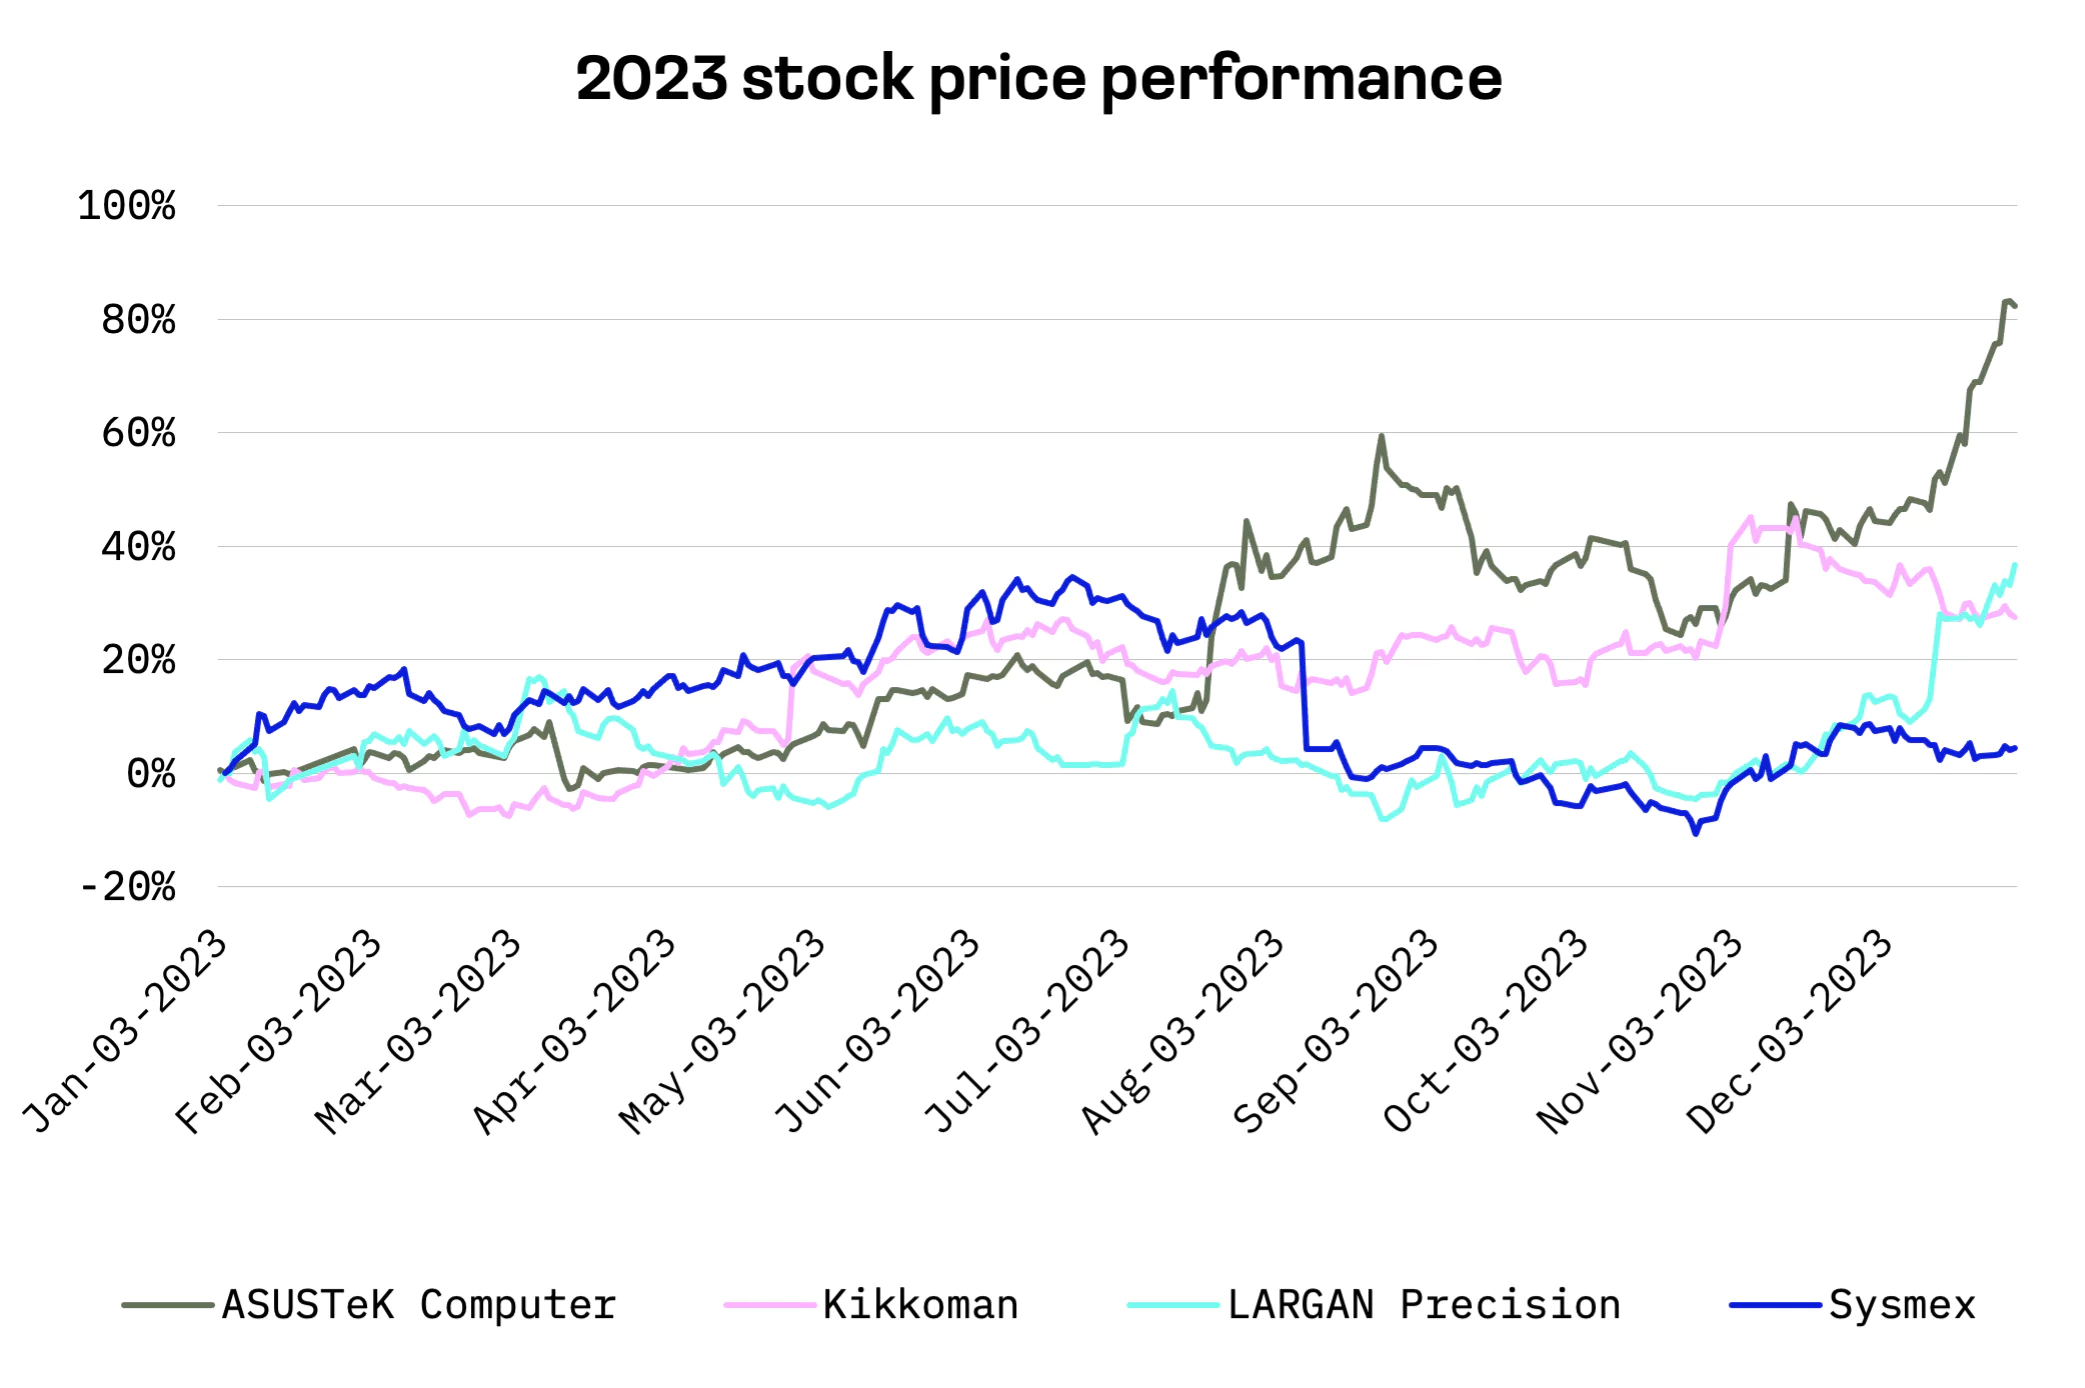
In the last year, ASUSTeK Computer experienced a significant share price increase of over 80%, driven largely by impressive profit growth, especially in the third quarter. The company announced a remarkable 329% jump in net profit from the previous quarter. Moreover, aligning with the evolving trend of generative AI, ASUSTeK has announced a strategic initiative to launch its first AI-enabled computer series in 2024.
LARGAN Precision also observed a sharp rise in its share price in the final quarter of 2024, bolstered by enhancements in operational performance. The company attributes this positive trend to two key factors: the increased price of its tetraprism telephoto lens, designed specifically for the iPhone 15 Pro Max, and improved yield rates in the production of lenses with new specifications.

In valuation terms, ASUSTeK Computer emerges as the most affordable option among the four new additions to the JAKOTA Blue Chip 150 Index when evaluated by TEV/Revenues. However, it’s important to note that its P/E ratio is concurrently the highest among these companies.
| Company | TEV/Total Revenues LTM | TEV/EBITDA LTM | P/Diluted EPS LTM |
| ASUSTeK Computer | 0.6x | 42.3x | 40.9x |
| Kikkoman | 2.8x | 20.8x | 36.9x |
| LARGAN Precision | 5.2x | 10.7x | 20.7x |
| Sysmex | 4.0x | 16.3x | 40.5x |
| MEAN | 3.2x | 22.5x | 34.8x |
| MEDIAN | 3.4x | 18.6x | 38.7x |
In a surprising turn, projections indicate a decline in sales for ASUSTeK Computer in the current financial year. Despite this, the company is expected to counterbalance this downturn with a resilient increase in net income, marking a significant compensatory factor.
ASUSTeK Computer: Key financial indicators, TWD million
| For the Fiscal Period Ending | 12 months Dec-31-2020A | 12 months Dec-31-2021A | 12 months Dec-31-2022A | LTM 12 months Sep-30-2023A | 12 months Dec-31-2023E |
| Total Revenue | 412,780.4 | 535,238.7 | 537,191.9 | 489,229.6 | 485,829.85 |
| Growth Over Prior Year | 17.5% | 29.7% | 0.4% | (13.0%) | (9.56%) |
| Gross Profit | 73,225.7 | 110,315.9 | 74,140.9 | 63,818.9 | – |
| Margin % | 17.7% | 20.6% | 13.8% | 13.0% | 14.87% |
| EBITDA | 27,477.5 | 52,106.9 | 14,692.1 | 5,097.3 | 13,930.29 |
| Margin % | 6.7% | 9.7% | 2.7% | 1.0% | 2.87% |
| EBIT | 24,957.1 | 49,325.6 | 12,982.2 | 3,373.0 | 12,863.36 |
| Margin % | 6.0% | 9.2% | 2.4% | 0.7% | 2.65% |
| Earnings from Cont. Ops. | 25,802.9 | 46,605.4 | 16,831.5 | 10,063.8 | – |
| Margin % | 6.3% | 8.7% | 3.1% | 2.1% | – |
| Net Income | 26,557.7 | 44,549.8 | 14,690.8 | 8,177.9 | 16,919.54 |
| Margin % | 6.4% | 8.3% | 2.7% | 1.7% | 3.48% |
| Diluted EPS Excl. Extra Items | 31.91 | 59.21 | 19.62 | 10.97 | 22.81 |
| Growth Over Prior Year | 66.3% | 85.6% | (66.9%) | (73.0%) | 15.33% |
Kikkoman: Key financial indicators, JPY million
| For the Fiscal Period Ending | 12 months Mar-31-2021A | 12 months Mar-31-2022A | 12 months Mar-31-2023A | LTM 12 months Sep-30-2023A | 12 months Mar-31-2024E |
| Total Revenue | 439,411 | 516,440 | 618,899 | 636,254 | 666,030 |
| Growth Over Prior Year | (6.2%) | 17.5% | 19.8% | 11.0% | 7.62% |
| Gross Profit | 154,233 | 178,829 | 204,425 | 213,784 | – |
| Margin % | 35.1% | 34.6% | 33.0% | 33.6% | 33.88% |
| EBITDA | 62,342 | 69,922 | 80,130 | 83,937 | 89,974 |
| Margin % | 14.2% | 13.5% | 12.9% | 13.2% | 13.51% |
| EBIT | 43,107 | 49,892 | 57,890 | 61,031 | 64,590 |
| Margin % | 9.8% | 9.7% | 9.4% | 9.6% | 9.70% |
| Earnings from Cont. Ops. | 31,621 | 39,344 | 44,199 | 49,685 | – |
| Margin % | 7.2% | 7.6% | 7.1% | 7.8% | – |
| Net Income | 31,159 | 38,903 | 43,733 | 49,250 | 51,394 |
| Margin % | 7.1% | 7.5% | 7.1% | 7.7% | 7.72% |
| Diluted EPS Excl. Extra Items | 162.31 | 202.93 | 228.37 | 257.5 | 269.63 |
| Growth Over Prior Year | 17.2% | 25.0% | 12.5% | 20.8% | 18.07% |
LARGAN Precision: Key financial indicators, TWD million
| For the Fiscal Period Ending | 12 months Dec-31-2020A | 12 months Dec-31-2021A | 12 months Dec-31-2022A | LTM 12 months Sep-30-2023A | 12 months Dec-31-2023E |
| Total Revenue | 55,944.5 | 46,962.4 | 47,675.2 | 45,349.3 | 48,857.75 |
| Growth Over Prior Year | (7.9%) | (16.1%) | 1.5% | (2.1%) | 2.48% |
| Gross Profit | 37,467.6 | 28,148.6 | 26,095.6 | 22,392.6 | – |
| Margin % | 67.0% | 59.9% | 54.7% | 49.4% | 46.13% |
| EBITDA | 36,247.5 | 27,750.5 | 25,357.8 | 21,872.4 | 22,146.09 |
| Margin % | 64.8% | 59.1% | 53.2% | 48.2% | 45.33% |
| EBIT | 32,032.1 | 23,148.1 | 20,384.1 | 16,690.0 | 16,534.44 |
| Margin % | 57.3% | 49.3% | 42.8% | 36.8% | 33.84% |
| Earnings from Cont. Ops. | 24,534.1 | 18,671.2 | 22,625.0 | 16,961.6 | – |
| Margin % | 43.9% | 39.8% | 47.5% | 37.4% | – |
| Net Income | 24,534.1 | 18,671.2 | 22,625.0 | 16,961.6 | 18,160.25 |
| Margin % | 43.9% | 39.8% | 47.5% | 37.4% | 37.17% |
| Diluted EPS Excl. Extra Items | 180.94 | 137.49 | 166.89 | 125.7 | 137.52 |
| Growth Over Prior Year | (13.3%) | (24.0%) | 21.4% | (28.0%) | (17.60%) |
Sysmex: Key financial indicators, JPY million
| For the Fiscal Period Ending | 12 months Mar-31-2021A | 12 months Mar-31-2022A | 12 months Mar-31-2023A | LTM 12 months Sep-30-2023A | 12 months Mar-31-2024E |
| Total Revenue | 305,073.0 | 363,780.0 | 410,502.0 | 429,178.0 | 453,362.88 |
| Growth Over Prior Year | 1.0% | 19.2% | 12.8% | 10.3% | 10.44% |
| Gross Profit | 154,303.0 | 190,585.0 | 216,083.0 | 228,558.0 | – |
| Margin % | 50.6% | 52.4% | 52.6% | 53.3% | 53.11% |
| EBITDA | 77,221.0 | 96,384.0 | 107,204.0 | 109,512.0 | 116,851.81 |
| Margin % | 25.3% | 26.5% | 26.1% | 25.5% | 25.77% |
| EBIT | 51,646.0 | 68,953.0 | 75,397.0 | 76,070.0 | 81,613.02 |
| Margin % | 16.9% | 19.0% | 18.4% | 17.7% | 18.00% |
| Earnings from Cont. Ops. | 33,103.0 | 44,072.0 | 45,725.0 | 43,958.0 | – |
| Margin % | 10.9% | 12.1% | 11.1% | 10.2% | – |
| Net Income | 33,142.0 | 44,093.0 | 45,784.0 | 43,981.0 | 52,983.08 |
| Margin % | 10.9% | 12.1% | 11.2% | 10.2% | 11.69% |
| Diluted EPS Excl. Extra Items | 158.39 | 210.49 | 218.73 | 210.08 | 253.12 |
| Growth Over Prior Year | (5.1%) | 32.9% | 3.9% | (4.0%) | 15.67% |


