Tuna has emerged as a culinary staple, especially in the traditional cuisines of South Korea and Japan, highlighting its influence in their seafood-centric gastronomy.
Both Japan and South Korea are key figures in the international tuna trade, serving as significant consumers and exporters. In 2022, South Korea topped the list of tuna exporters, with Japan leading as the foremost importer, according to Tridge.
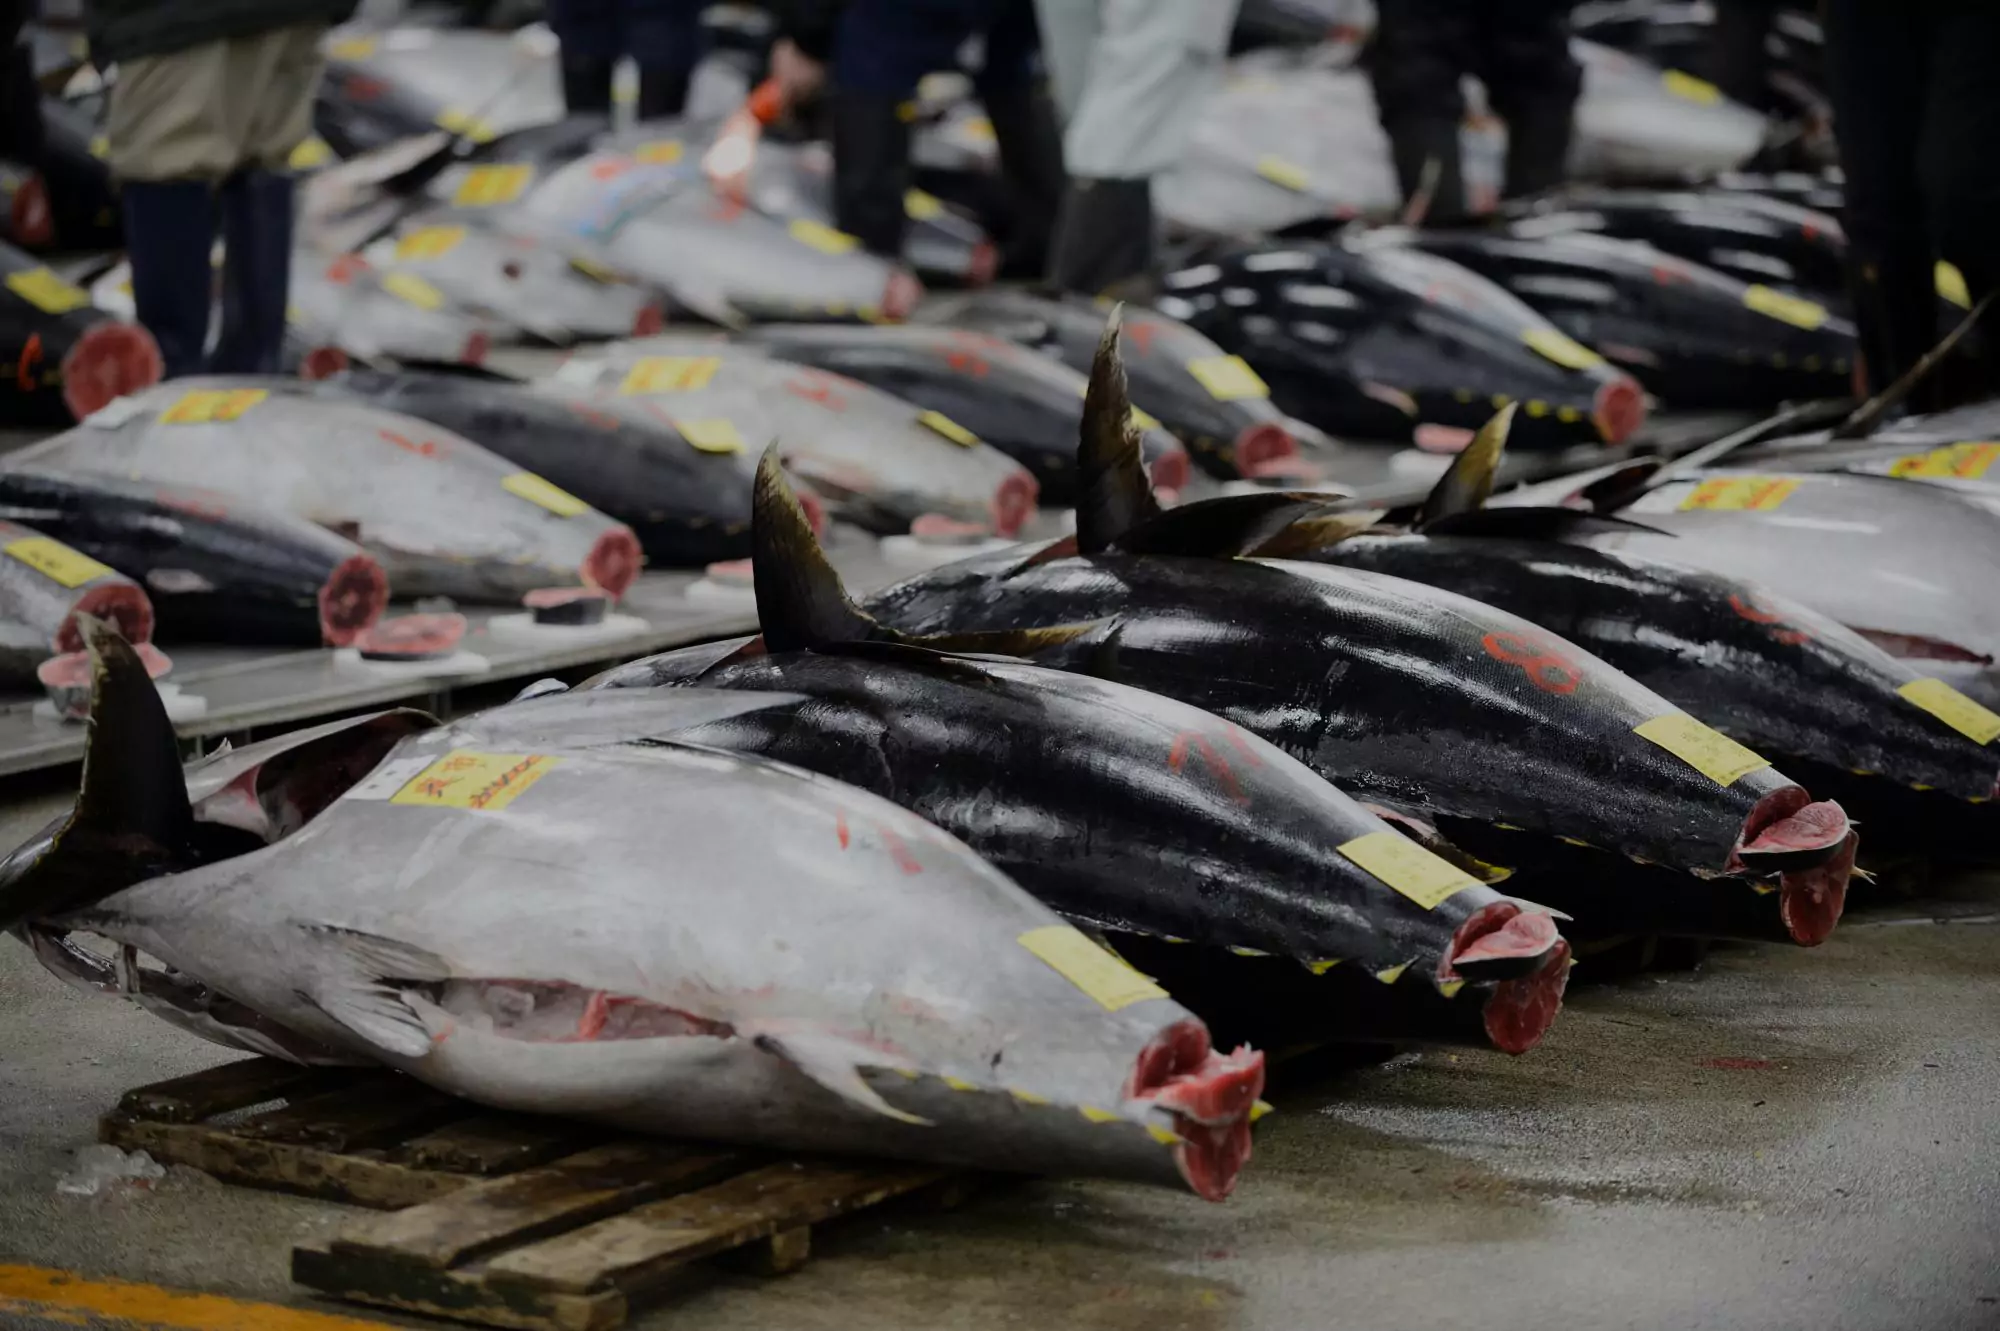
The Tsukiji Fish Market in Tokyo, one of the world’s largest and most renowned fish markets, exemplifies the integral role of tuna in Japanese culture and cuisine. A notable 46% of the market’s frozen fish and seafood sales are attributed to frozen tuna, contributing 23% to the fresh fish and seafood segment.
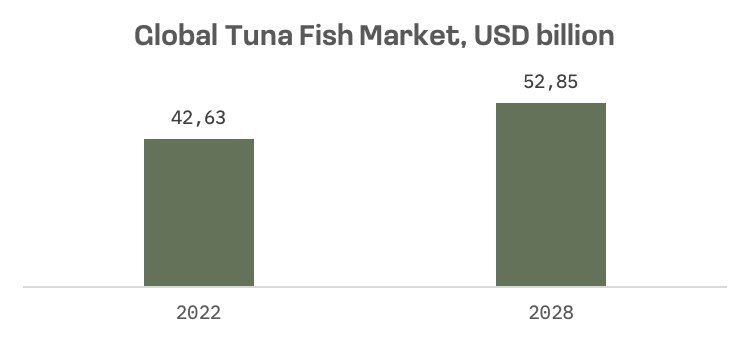
Renub Research predicts the Global Tuna Fish Market will reach an estimated $52.85 billion by 2028, growing at a 3.65% CAGR from 2022 to 2028.
In Japan and South Korea’s public tuna market sector, three major players dominate:
| Nissui | Maruha Nichiro | Dongwon Industries | |
| JAKOTA Index | Mid and Small Cap 2000 | Mid and Small Cap 2000 | Mid and Small Cap 2000 |
| Country | Japan | Japan | South Korea |
| Brief description | Major Japanese seafood company with a significant presence in the tuna market. | Engaged in seafood and aquaculture-related businesses (Bluefin tuna farms). | South Korean conglomerate with a focus on fisheries. Tuna is one of the key products in its extensive range. |
| Market cap, $ mn | 1,454.7 | 926.1 | 862.7 |
Although several publicly traded companies have a presence in the tuna industry, many of them possess a market capitalization lower than $100 million. Consequently, our focused analysis is on the three aforementioned companies, which are notable constituents of the JAKOTA Mid and Small Cap 2000 Index due to their larger market capitalizations.
The share prices of Nissui, Maruha Nichiro, and Dongwon Industries have varied considerably in the past six months.
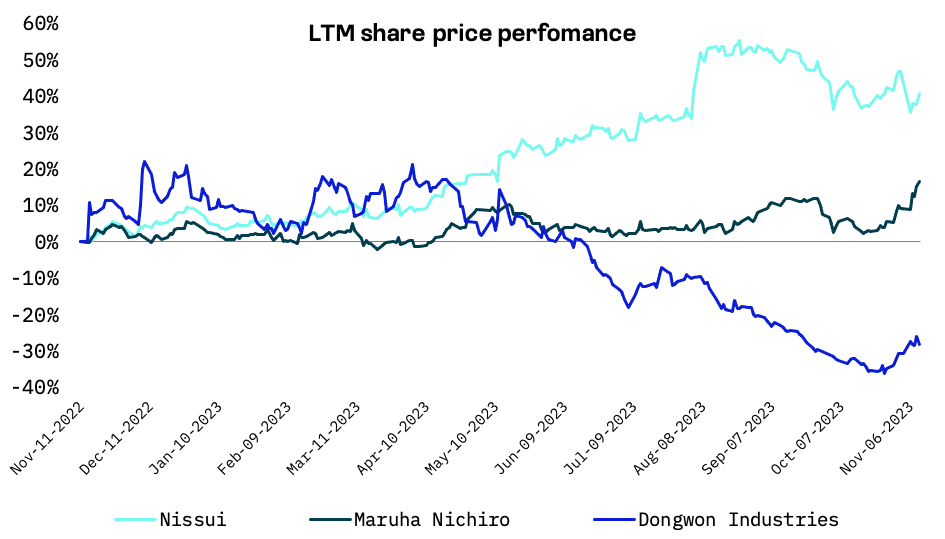
Despite this, the companies exhibit significant similarities in major operational indicators.
| Nissui | Maruha Nichiro | Dongwon Industries | |
| Operational indicators: | |||
| LTM Total Revenue, $mn | 5,268.1 | 6,881.7 | 6,892.0 |
| LTM EBITDA, $mn | 324.6 | 311.5 | 556.1 |
| LTM EBITDA margin, % | 6.2% | 4.5% | 8.1% |
| LTM EBIT, $mn | 181.1 | 197.7 | 329 |
| Trading multiples: | |||
| TEV/Total Revenues | 0.5 | 0.4 | 0.4 |
| TEV/EBITDA | 8.3 | 9.3 | 5.1 |
| TEV/EBIT | 14.3 | 14.4 | 8.6 |
| P/Diluted EPS | 10.4 | 8.6 | 7.2 |
For the fiscal year ending March 31, 2023, Nissui reported a solid sales growth of 10.7%. During this period, the company’s aquaculture business also experienced notable performance improvements due to enhanced growth environments and operations.
Nissui: Key financial indicators, JPY million
| For the Fiscal Period Ending | 12 months Mar-31-2020A | 12 months Mar-31-2021A | 12 months Mar-31-2022A | 12 months Mar-31-2023A | LTM 12 months Sep-30-2023A |
| Total Revenue | 690,016.0 | 656,491.0 | 693,682.0 | 768,181.0 | 798,108.0 |
| Growth Over Prior Year | (3.1%) | (4.9%) | 5.7% | 10.7% | 1.8% |
| Gross Profit | 133,798.0 | 127,177.0 | 111,080.0 | 116,052.0 | 120,823.0 |
| Margin | 19.4% | 19.4% | 16.0% | 15.1% | 15.1% |
| EBITDA | 42,549.0 | 37,951.0 | 47,043.0 | 45,203.0 | 49,170.0 |
| Margin | 6.2% | 5.8% | 6.8% | 5.9% | 6.2% |
| EBIT | 22,836.0 | 18,080.0 | 27,077.0 | 24,489.0 | 27,439.0 |
| Margin | 3.3% | 2.8% | 3.9% | 3.2% | 3.4% |
| Earnings from Cont. Ops. | 15,286.0 | 15,204.0 | 18,347.0 | 22,030.0 | 21,729.0 |
| Margin | 2.2% | 2.3% | 2.6% | 2.9% | 2.7% |
| Net Income | 14,768.0 | 14,452.0 | 17,275.0 | 21,233.0 | 21,171.0 |
| Margin | 2.1% | 2.2% | 2.5% | 2.8% | 2.7% |
| Diluted EPS Excl. Extra Items | 47.46 | 46.45 | 55.51 | 68.22 | 68.02 |
| Growth Over Prior Year | (3.9%) | (2.1%) | 19.5% | 22.9% | (7.9%) |
Despite Maruha Nichiro’s sales surged by 17.7% in the same period, its share performance stayed relatively unchanged until October.This changed significantly with the announcement of Maruha Nichiro’s decision to merge two of its consolidated subsidiaries, Marine Access and Maruha Nichiro Retail Service, forming a new entity named ‘Maruha Nichiro Ocean.’
Before this strategic merger, Maruha Nichiro had finalized plans to acquire Nippon Access’s 35% stake in Marine Access, aiming to make it a wholly owned subsidiary. The successful completion of this acquisition is a crucial step in Maruha Nichiro’s corporate evolution, marking a significant enhancement in its market position and the optimization of operational synergies.
Maruha Nichiro: Key financial indicators, JPY million
| For the Fiscal Period Ending | 12 months Mar-31-2020A | 12 months Mar-31-2021A | 12 months Mar-31-2022A | 12 months Mar-31-2023A | LTM 12 months Sep-30-2023A |
| Total Revenue | 905,204.0 | 862,585.0 | 866,702.0 | 1,020,456.0 | 1,042,571.0 |
| Growth Over Prior Year | (1.9%) | (4.7%) | 0.5% | 17.7% | 10.9% |
| Gross Profit | 118,069.0 | 116,203.0 | 120,497.0 | 135,255.0 | 136,628.0 |
| Margin | 13.0% | 13.5% | 13.9% | 13.3% | 13.1% |
| EBITDA | 33,719.0 | 33,377.0 | 41,570.0 | 45,829.0 | 47,196.0 |
| Margin | 3.7% | 3.9% | 4.8% | 4.5% | 4.5% |
| EBIT | 17,080.0 | 16,209.0 | 23,820.0 | 29,134.0 | 29,958.0 |
| Margin | 1.9% | 1.9% | 2.7% | 2.9% | 2.9% |
| Earnings from Cont. Ops. | 14,769.0 | 8,923.0 | 20,320.0 | 24,486.0 | 20,966.0 |
| Margin | 1.6% | 1.0% | 2.3% | 2.4% | 2.0% |
| Net Income | 12,537.0 | 5,778.0 | 16,898.0 | 18,596.0 | 16,361.0 |
| Margin | 1.4% | 0.7% | 1.9% | 1.8% | 1.6% |
| Diluted EPS Excl. Extra Items | 238.23 | 109.8 | 321.12 | 363.67 | 324.13 |
| Growth Over Prior Year | (24.9%) | (53.9%) | 192.5% | 13.2% | (17.8%) |
Dongwon Industries experienced the weakest share price performance among its peers, a trend that was exacerbated by a series of significant corporate events and M&A news. Notably, there was dissatisfaction among minority shareholders over the November 2022 merger, where Dongwon Industries absorbed Dongwon Enterprise.
On June 9, 2023, the company faced removal from the KOSPI 200 Index, a reflection of its challenging market position. This was followed by a pivotal decision to cancel the planned acquisition of Boryung Biopharma, a transaction valued at 500 billion won ($384 million). This move, which would have marked Dongwon Group’s first foray into the biopharmaceutical sector in its 54-year history, drew skepticism from shareholders regarding the company’s diversification strategy.
Furthermore, Dongwon Industries emerged as the sole contender in a preliminary bid for acquiring McDonald’s Korea, estimated at a similar valuation of about 500 billion won. However, in a surprising development, Dongwon Group withdrew its bid, citing major disagreements with McDonald’s U.S. headquarters over the management strategy for the Korean branch. The complexities of the negotiation process and the irreconcilable differences in contractual terms were highlighted as key factors in this decision, with specific details remaining undisclosed due to legal constraints.
In addition, Dongwon Industries has been shortlisted, along with LX Group and Harim, as a potential acquirer for HMM Co., South Korea’s largest container carrier. In a strategic move, Dongwon Group, the holding entity for Dongwon Industries, is reportedly in the final stages of preparing a substantial fundraising initiative. This involves raising up to 600 billion won ($457 million) through its U.S.-based subsidiary, StarKist, one of the world’s largest canned tuna enterprises. The group plans to issue convertible bonds (CBs) for StarKist, aiming to raise approximately 500 to 600 billion won, a strategy closely linked to a potential initial public offering (IPO) for StarKist.
Dongwon Industries: Key financial indicators, WON million
| For the Fiscal Period Ending | 12 months Dec-31-2019A | 12 months Dec-31-2020A | 12 months Dec-31-2021A | 12 months Dec-31-2022A | LTM 12 months Jun-30-2023A |
| Total Revenue | 2 682 595.1 | 2 857 331.3 | 7 602 999.7 | 9 026 258.4 | 9 094 130.7 |
| Growth Over Prior Year | 9.7% | 6.5% | 166.1% | 18.7% | (14.6%) |
| Gross Profit | 407 181.9 | 492 708.3 | 1 446 634.7 | 1 491 703.2 | 1 463 384.9 |
| Margin | 15.2% | 17.2% | 19.0% | 16.5% | 16.1% |
| EBITDA | 319 270.4 | 435 919.5 | 782 739.3 | 793 490.3 | 733 753.1 |
| Margin | 11.9% | 15.3% | 10.3% | 8.8% | 8.1% |
| EBIT | 188,670.8 | 307,385.7 | 508,664.0 | 494,432.7 | 434,072.2 |
| Margin | 7.0% | 10.8% | 6.7% | 5.5% | 4.8% |
| Earnings from Cont. Ops. | 51,402.8 | 243,645.0 | 315,039.6 | 296,545.3 | 220,549.0 |
| Margin | 1.9% | 8.5% | 4.1% | 3.3% | 2.4% |
| Net Income | 44,821.9 | 240,628.9 | 233,292.6 | 186,478.0 | 153,242.3 |
| Margin | 1.7% | 8.4% | 3.1% | 2.1% | 1.7% |
| Diluted EPS Excl. Extra Items | 2,526.92 | 14,024.9 | 7,383.97 | 5,747.55 | 4,415.1 |
| Growth Over Prior Year | (38.5%) | 455.0% | (47.4%) | (22.2%) | (38.3%) |