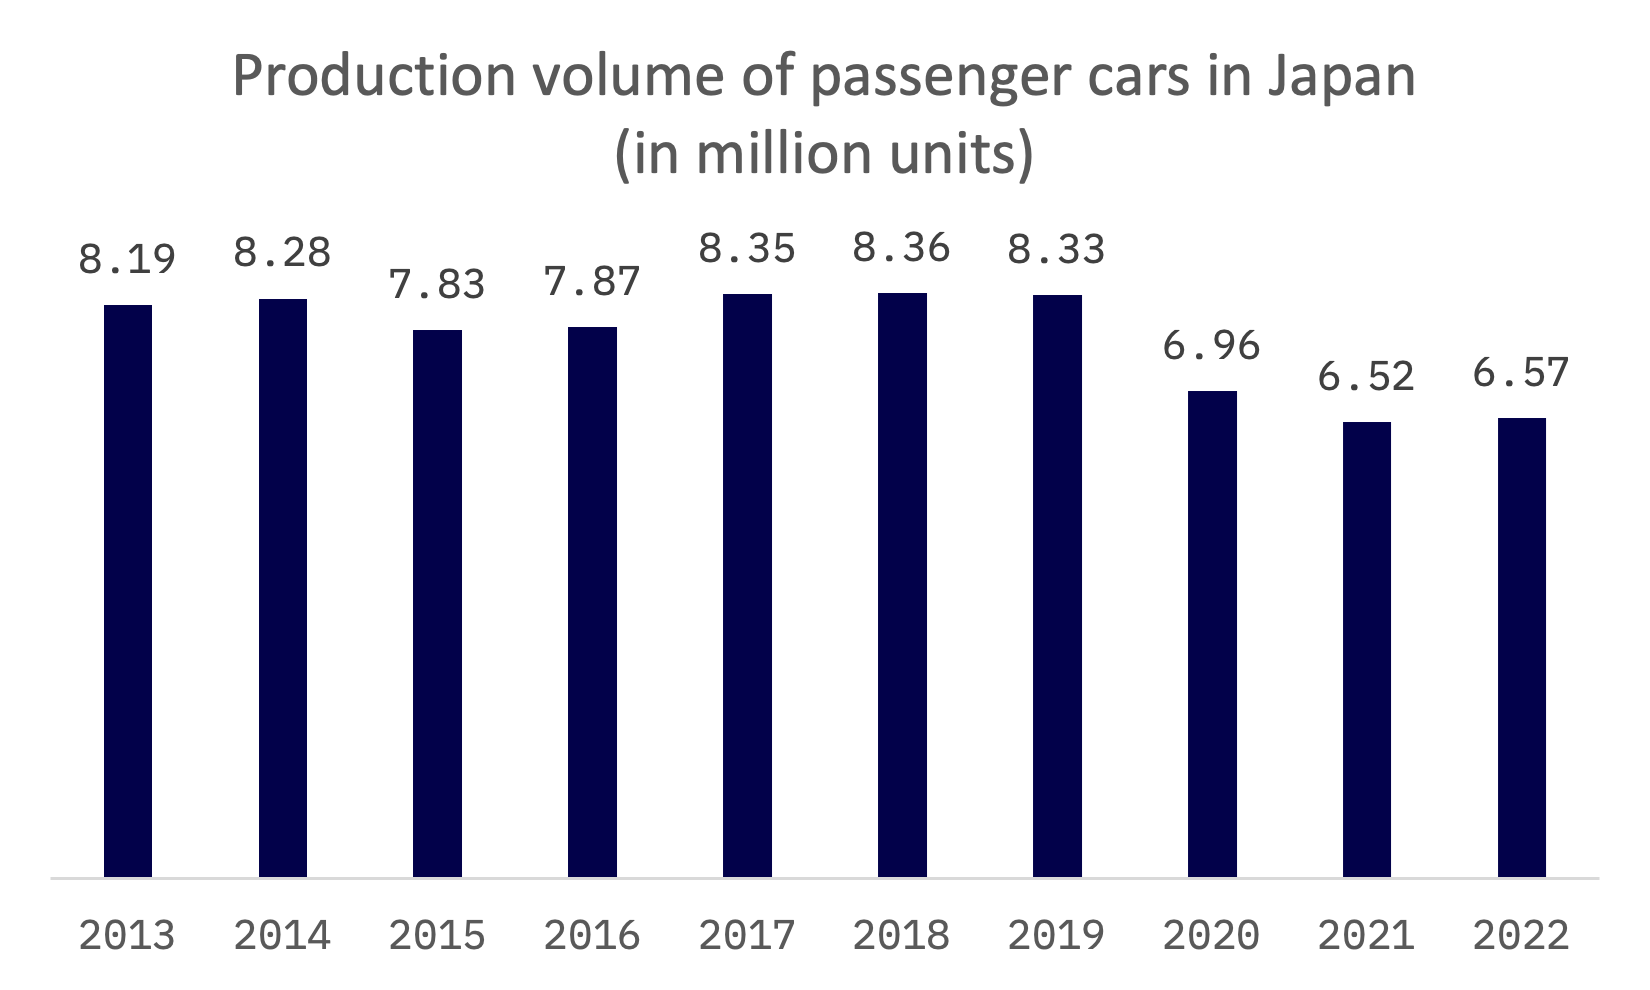
In 2022, despite losing its position as the world’s third-largest automotive market to India, Japan’s automobile industry demonstrated remarkable resilience and influence, both domestically and globally. While the industry registered a 6% decrease in motor vehicle registrations to 4.2 million, it still produced over 6.5 million passenger cars. This downturn was short-lived, as evidenced by the Japanese auto market’s remarkable recovery in the first half of 2023, with passenger car sales experiencing a 27% year-on-year growth.
Japan hosts some of the largest and most influential automobile manufacturers in the world. Global industry leaders such as Toyota, Honda, Nissan, Subaru, Suzuki, Mazda, Mitsubishi, and Isuzu, all publicly traded on the Tokyo Stock Exchange, underscore the country’s pivotal role in the international automotive market. Except for Mitsubishi Motors, these companies have seen their stock prices rise significantly over the last 12 months, signaling strong market confidence.
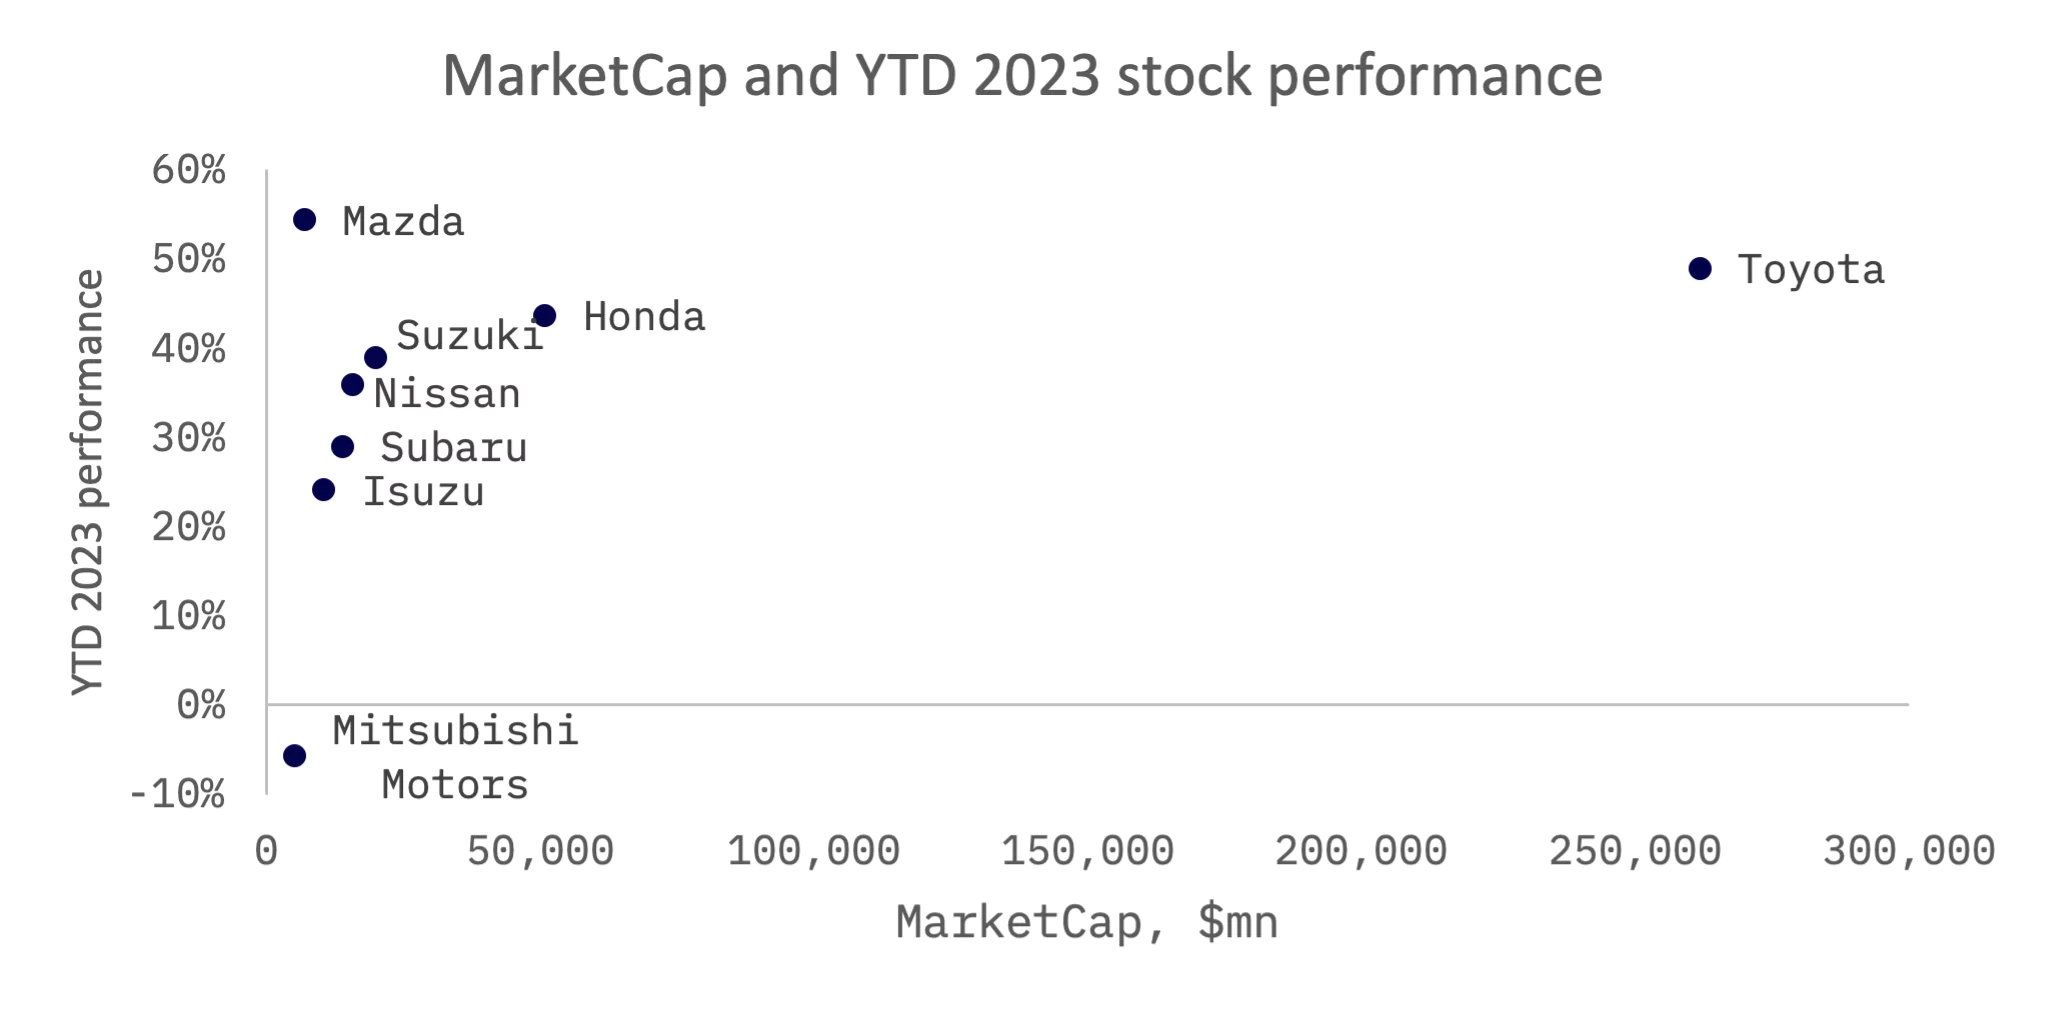
In 2023, a clear correlation between market capitalization and stock performance was evident across the industry. Mazda stands out as an exceptional case: despite having the second-lowest market capitalization (after Mitsubishi Motors), its stock increased by an impressive 54.5%, putting it in line with industry leaders Toyota and Honda in terms of stock value appreciation.
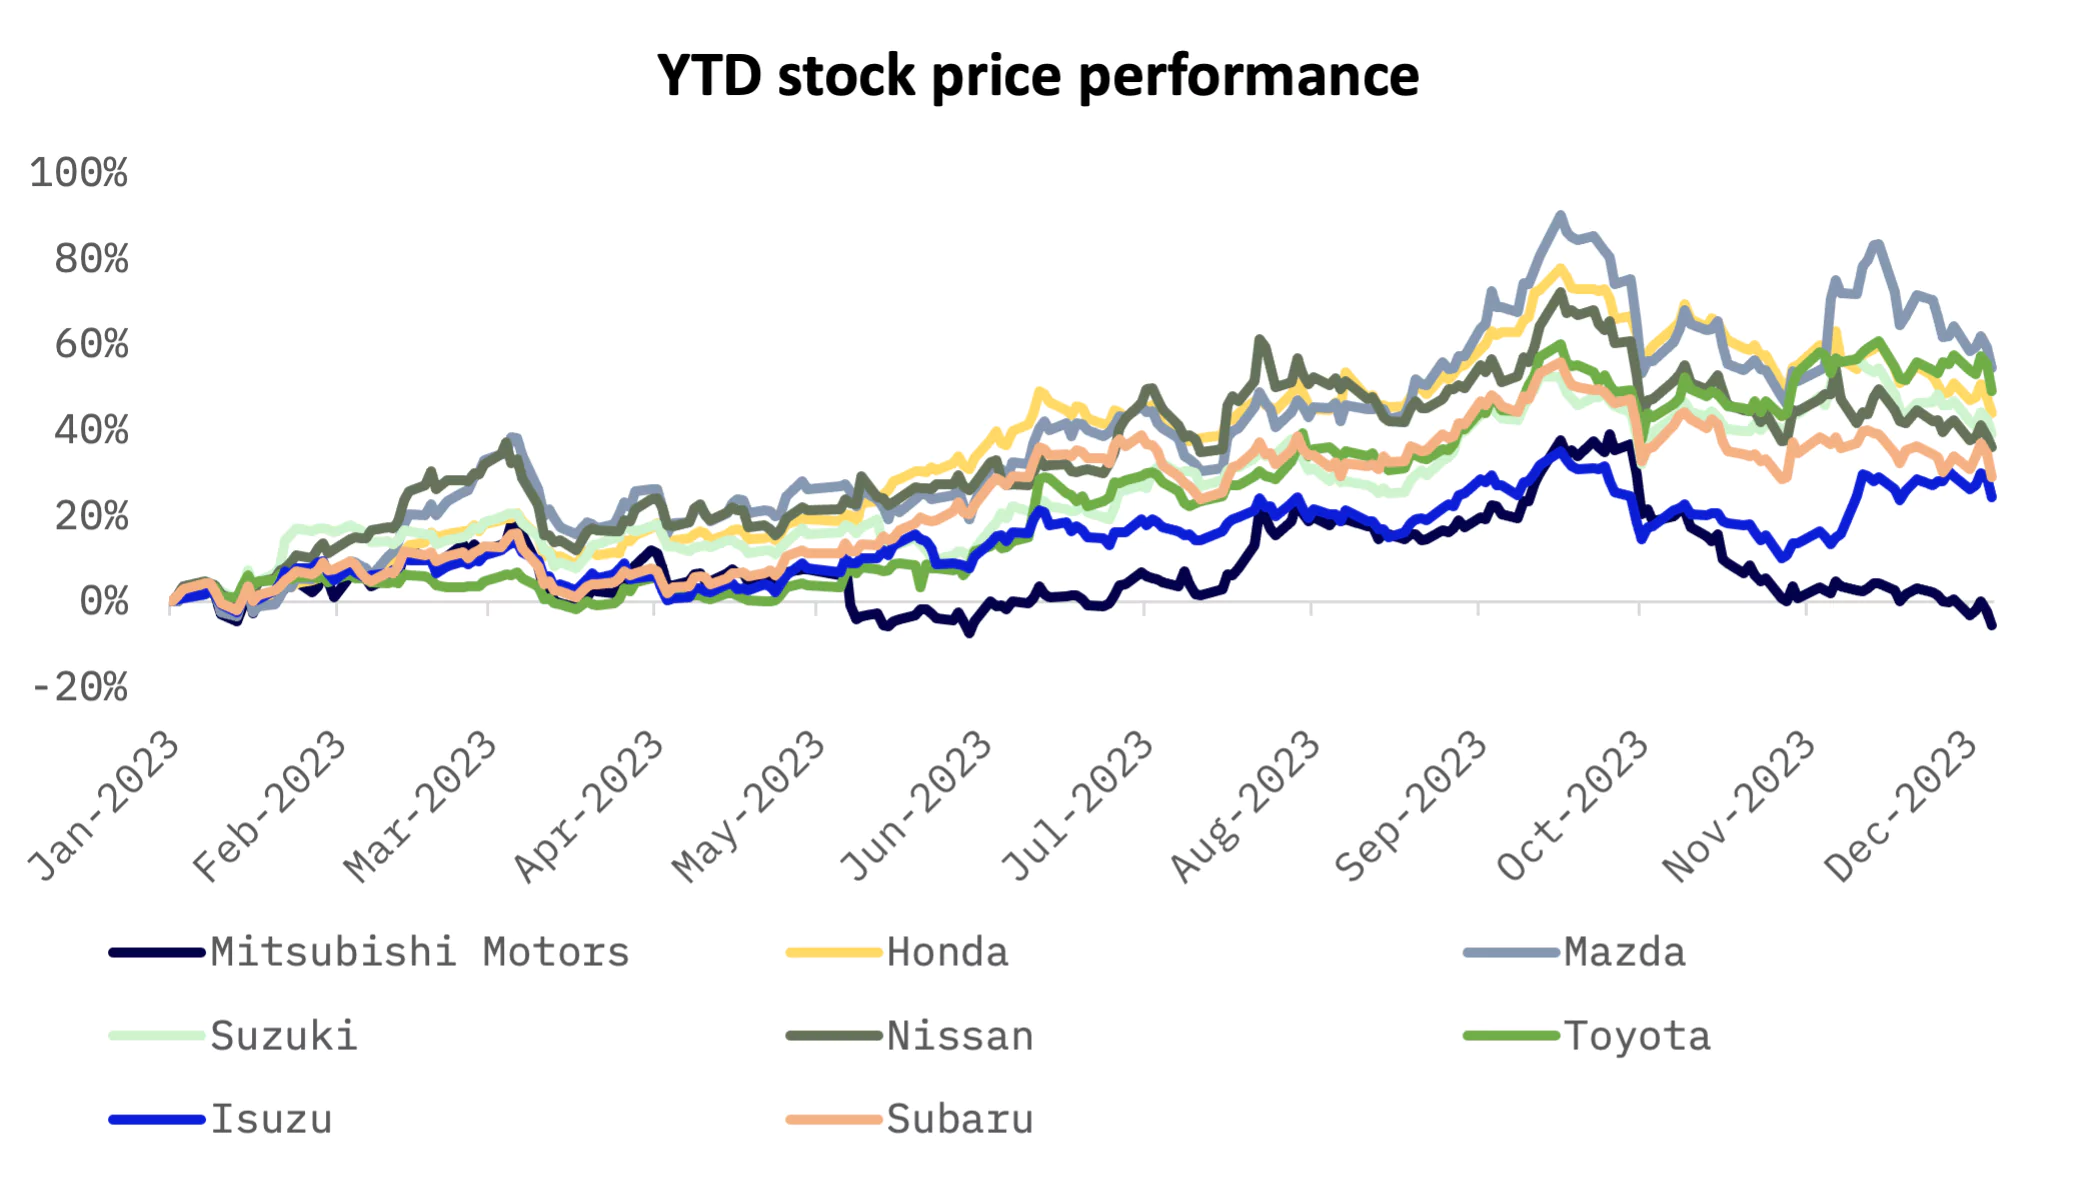
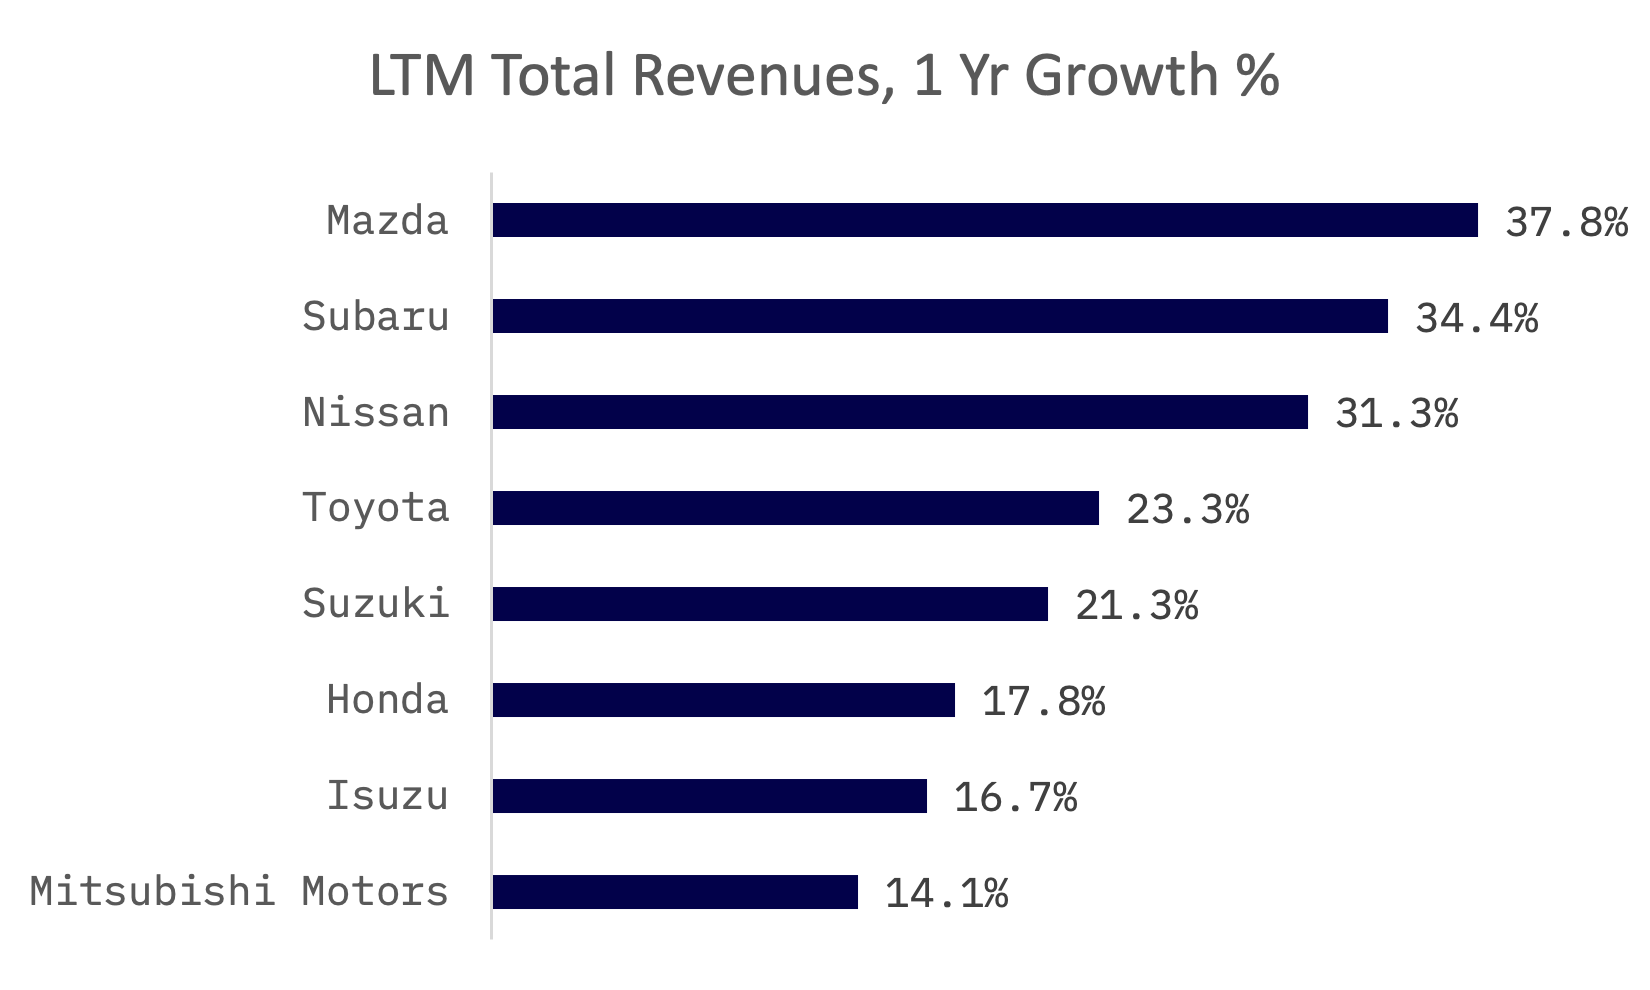
It is not surprising that Mazda’s remarkable stock performance mirrors its strong sales growth over the last 12 months.
Over the six months from March to September 2023, Mazda’s sales results across all key markets revealed a robust performance, particularly in the United States and Europe.
In the United States, Mazda’s sales saw a significant upswing, with 184,000 units sold, marking a 38% increase compared to the previous year. This growth was propelled not only by the popularity of the CX-5 and CX-30 models but also by the expanded production of the CX-50 following the start of a second shift at the Alabama plant. Additionally, the April launch of the CX-90 made a substantial contribution to this sales surge.
In Europe, Mazda’s sales momentum was equally impressive, with 90,000 units sold, translating to a 34% year-on-year increase. The CX-60 and CX-5 models were instrumental in driving this growth. Particularly noteworthy was the performance of the CX-60, which saw sales of 7,000 units in the second quarter alone, with sustained high demand, especially for its plug-in hybrid variants.
In the Japanese market, Mazda also experienced significant growth, with sales of 82,000 units, a 20% increase from the previous year. The CX-60 and CX-8 models were key contributors to this uptick in sales.
Mazda: Key financial indicators, JPY million
| For the Fiscal Period Ending | 12 months Mar-31-2021A | 12 months Mar-31-2022A | 12 months Mar-31-2023A | 12 months Sep-30-2023A | 12 months Mar-31-2024E |
| Total Revenue | 2,882,066 | 3,120,349 | 3,826,752 | 4,501,505 | 4,874,597 |
| Growth Over Prior Year | (16.0%) | 8.3% | 22.6% | 37.8% | 27.4% |
| Gross Profit | 613,644 | 687,704 | 801,522 | 931,295 | – |
| Margin % | 21.3% | 22.0% | 20.9% | 20.7% | 20.7% |
| EBITDA | 98,585 | 194,508 | 247,919 | 326,649 | 379,924 |
| Margin % | 3.4% | 6.2% | 6.5% | 7.3% | 7.8% |
| EBIT | 8,820 | 104,227 | 141,969 | 216,339 | 270,042 |
| Margin % | 0.3% | 3.3% | 3.7% | 4.8% | 5.5% |
| Earnings from Cont. Ops. | (32,054) | 82,347 | 144,239 | 166,660 | – |
| Margin % | (1.1%) | 2.6% | 3.8% | 3.7% | – |
| Net Income | (31,651) | 81,557 | 142,814 | 165,087 | 190,520 |
| Margin % | (1.1%) | 2.6% | 3.7% | 3.7% | 3.9% |
| Diluted EPS Excl. Extra Items | (50.26) | 129.38 | 226.52 | 261.82 | 302.4 |
| Growth Over Prior Year | NM | NM | 75.1% | 15.0% | 33.4% |
Toyota stands as the most valuable company in its peer group, as evidenced by its EV/Sales and EV/EBITDA ratios, and trails only slightly behind Suzuki in the P/E ratio.
| Company Name | TEV/Total Revenues LTM | TEV/EBITDA LTM | P/EPS LTM |
| Honda | 0.7x | 4.8x | 8.0x |
| Isuzu | 0.5x | 4.4x | 9.0x |
| Mazda | 0.2x | 2.3x | 5.9x |
| Mitsubishi Motors | 0.2x | 2.0x | 4.6x |
| Nissan | 0.7x | 6.8x | 4.9x |
| Subaru | 0.2x | 1.3x | 7.5x |
| Suzuki | 0.6x | 5.0x | 12.1x |
| Toyota | 1.5x | 9.3x | 9.8x |
| MEAN | 0.6x | 4.5x | 7.7x |
| MEDIAN | 0.6x | 4.6x | 7.8x |
Toyota’s premium valuation is a direct reflection of its commanding position in the Japanese auto market. In a significant display of market dominance, Toyota, along with its luxury brand Lexus, accounted for a substantial 54.6% of the domestic market share, according to data from the Japan Automobile Dealers Association covering the period from January to November 2023. This figure represents a notable 31.8% growth compared to the same period in the previous year, vividly underscoring Toyota’s robust market presence and exceptional performance in the Japanese automotive sector.
Toyota: Key financial indicators, JPY million
| For the Fiscal Period Ending | 12 months Mar-31-2021A | 12 months Mar-31-2022A | 12 months Mar-31-2023A | 12 months Sep-30-2023A | 12 months Mar-31-2024E |
| Total Revenue | 27,214,593 | 31,379,507 | 37,154,298 | 41,426,567 | 44,029,605 |
| Growth Over Prior Year | (8.9%) | 15.3% | 18.4% | 23.3% | 18.5% |
| Gross Profit | 4,832,373 | 5,971,673 | 6,313,016 | 7,930,978 | – |
| Margin % | 17.8% | 19.0% | 17.0% | 19.1% | 18.8% |
| EBITDA | 3,689,496 | 4,463,843 | 4,403,262 | 5,824,950 | 6,295,083 |
| Margin % | 13.6% | 14.2% | 11.9% | 14.1% | 14.3% |
| EBIT | 2,197,748 | 2,995,696 | 2,725,026 | 4,142,876 | 4,753,482 |
| Margin % | 8.1% | 9.5% | 7.3% | 10.0% | 10.8% |
| Earnings from Cont. Ops. | 2,282,379 | 2,874,614 | 2,492,968 | 3,920,933 | – |
| Margin % | 8.4% | 9.2% | 6.7% | 9.5% | – |
| Net Income | 2,245,261 | 2,850,110 | 2,451,318 | 3,869,662 | 4,237,520 |
| Margin % | 8.3% | 9.1% | 6.6% | 9.3% | 9.6% |
| Diluted EPS Excl. Extra Items | 158.93 | 205.23 | 179.47 | 285.1 | 306.38 |
| Growth Over Prior Year | 10.4% | 29.1% | (12.6%) | 57.2% | 70.7% |
As the global emphasis on sustainability grows, Japanese automakers, notably Toyota and Nissan, have been leading the way in developing electric and hybrid vehicles. In the first half of 2023, Battery Electric Vehicle (BEV) sales in Japan comprised only a modest 2% of the total passenger vehicle sales, in stark contrast to the robust sales of Hybrid Electric Vehicles (HEVs). Despite this, Japan is committed to transitioning all passenger vehicle sales to electrified options by 2035, in line with its broader goal of achieving net-zero emissions by 2050. To support this ambitious shift, the Japanese government has implemented incentives, including subsidies for purchasing BEVs, Plug-in Hybrid Electric Vehicles (PHEVs), and Fuel Cell Electric Vehicles (FCEVs).
In response, major domestic automakers like Toyota, Honda, Nissan, Suzuki, Mitsubishi, Subaru, and Mazda have relatively recently firmed up their EV strategies, with most revealing concrete plans as late as August of this year.
Toyota’s strategy for electric vehicles is particularly comprehensive, involving a significant increase in R&D spending and the establishment of a BEV Factory, a dedicated organization for battery electric vehicles launched in May. By 2030, Toyota aims to have produced 3.5 million units, with 1.7 million projected to come from the BEV Factory.
Additionally, Toyota is diversifying into a hydrogen business strategy, with plans for a new organization known as the Hydrogen Factory. This strategy involves expanding the sales of their fuel cell technology, developed initially for the Mirai model, to other companies or sectors. Toyota has set a target of selling 100,000 fuel cell units externally by 2030, with a primary focus on commercial vehicles, marking a significant step in their alternative energy initiatives.
